March 31st, 2022 by Richard

Interesting ratio developments around 4615 in the SPX.


Nb. Our comment from the 03/22/22


There are similarities with the rather odd FTSE here in the SPX, but not that many as it looks fairly conventional here at the moment.

Going back to last Wednesday, the rollover, we did see this index spend the majority of that day in or around its zone. Which back in the March expiry was at 4295-4305. Therefore, we are far more relaxed about what happened on the following Thu & Fri.

Worth noting though, that in March, Y2 started at 4405, and although the settlement price was just north of here, it wasn’t until this was out of the way before any significant gains happened on Friday.

What it did result in, especially as the zone here has been at 4395-4405 for quite some time, was that this index starts April in bullish territory.

This is very significant as it hasn’t been above its zone for a very long time.

In fact, just a stable zone would be a massive boon to the bulls.

All this looks very positive for this expiry, until that is we point out just how much minimal Y1 ratio there is.

This is important for two main reasons. Firstly, it means the zone is hardly establish, and so could move very easily, although this is equally true for either direction.

Secondly, with the Y1 ratio bandwidth coming in at 385 and the overall Y ratio bandwidth 610-points, these are some of the biggest numbers we have ever seen. And with so little ratio providing any sort of support or resistance by the naturally occurring dynamic delta, once this market realises this, it could go a very long way indeed with just the smallest impetus. It could also become very susceptible to whipsaw.

It looks ok for now, especially being in bullish territory, but don’t get fooled as 610-points is a 14% trading range, and that is in just four weeks.


Range:            4405  to  4580           

Activity:          Moderate

Type:              On balance bearish


Nb. Our comment for 03/31/22


It has been well over a week since we last commented on the SPX, so apologies for that, but there really hasn’t been very much to write home about anyway.

The big thing we should have mentioned was that Y2 above the zone moved from 4580 to 4605 the day after we last published, so the 23rd.

So really, all the market had been doing was to slowly claw its way up through all the Y1 above the zone.

The day of the possible peace talks headway caused the first point of interest as the market blasted through 4605 on Tuesday.

As you can see, today Y2 is 4615, so the market is back below it after Wednesday’s capitulation.

As this index has been sensitive to Y2 in the past, it is entirely understandable to perhaps give it more weight than its due, forgetting that in fact it is still just a Y ratio and therefore still classed as minimal.

But, as the old saying goes “in the land of the blind, the one-eyed man is king”. And so it can be in markets, as when there is no dynamic delta and then there is even some minimal amounts, this can have an effect.

And here is where it gets interesting, as from 4615 and above the ratios have actually strengthened, whereas between 4615 and the zone they have weakened before strengthening again below the zone.

The most obvious implication of this is that the zone will most probably move up.

The not so obvious, is that despite the market having already been higher, 4615 might prove harder to cross this time round.

Of course, all this comes with the usual proviso that what with the geopolitical situation being what it is, any sudden announcements could make whatever level of dynamic delta irrelevant.

But, in the absence of any new news, it seems the SPX is reverting to its previous degree of sensitivity, so the bulls might just want to rein it in a bit as the current zone is a long way south.


Range:            4405  to  4615           

Activity:          Moderate

Type:              Neutral


Available to buy now

The faction account of the Big Bang, The Great Storm and the market crash of 1987, available in eBook and paperback here, a must read if you don’t believe in history repeating itself.

Posted in Uncategorized Tagged with: , , , , , , , , , , ,

March 28th, 2022 by Richard

Big zone move leaves the FTSE in bullish territory, but now with R1 dead ahead.


Nb. Our comment from the 03/21/22

For the record the FTSE spent the entire rollover Wednesday in its zone, so that was definitely job done. The Thursday and Friday are then just free to do what they want after that really.

Looking at the April expiry and we have to remind everyone that we just crunch the numbers and then try to interpret the results, so we have no control whatsoever as to what those numbers actually are.

We are pointing this out as it does look a very weird expiry.

First up is the fact the zone is 7550-7650 which, when you consider this market just a fortnight ago was battling it out with the ratio at 6950, is just a little odd.

It is basically as if the March expiry never happened.

Secondly, and probably as a direct result of the very high zone, there is a 400-point wide Y1 ratio bandwidth below it. That’s 5.4%, and this is just to start.

Obviously, the zone could easily move anywhere in this bandwidth, which might change the picture somewhat, but one thing that won’t change that quickly is that this is a huge expanse with absolutely minimal ratio in it.

Then when you add in the zone itself and the Y ratio above it, you are then staring at a possible trading range of 7150 all the way up to 7700, a staggering 550-points, or 7.4%. And this is a normal 4-week expiry, well not entirely normal as it expires on Thursday 14th due to the Bank Holiday.

Definitely going to be a fun trip this expiry, so best buckle-up tight.


Range:            7150  to  7550       

Activity:          Strong

Type:              On balance bearish


Nb. Our comment on 03/28/22


We did say the zone could move anywhere within that ridiculously wide Y ratio bandwidth, and it has.

We should, but we don’t calculate this daily, so we don’t know exactly when this happened but, guessing by the lack of impetus in the market from Wednesday onwards, we suspect it was then.

As, don’t forget, when it was at 7550-7650 it would have acted like a magnet but, once it moved down to being below the market, it would be like the poles reversing.

However, at least now we are looking at a far more conventional ratio alignment, even though the Y1 ratio bandwidth is 300 and the overall Y ratio bandwidth 450-points, at least it is now interrupted by the zone in the middle.

And now, just like the SPX, London now finds itself in bullish territory. Which must come as bit of relief after March, but we suspect it probably took the final couple of days last week for the market to actually realise this as it didn’t really have to do anything to achieve it.

The problem the FTSE now faces is that R1 is just 70-points ahead of it. Although, if it can cope with that, and it is only just above the R1 threshold, then there is another 150-points before the far more serious R3 kicks in.

And before you get too carried away, it is a sobering thought that from aforementioned R1 at 7550, the top boundary of the zone is 200-points due south.

Furthermore, as there are still three weeks to go in this expiry there is plenty of time for a lot to happen in.

First things first though, and a test of R1 and a look at how this market reacts to this amount of dynamic delta will tell us an awful lot about what to expect thereafter. What would be worse is for it to drift aimlessly around its current level, although we think that this is unlikely especially considering where the SPX is in relation to their ratios.


Range:            7350  to  7550       

Activity:          Average

Type:              On balance bullish


Available to buy now

The faction account of the Big Bang, The Great Storm and the market crash of 1987, available in eBook and paperback here, a must read if you don’t believe in history repeating itself.

Posted in Uncategorized Tagged with: , , , , , , , , , , ,

March 22nd, 2022 by Richard

An ocean of Y ratio awaits the SPX in the April expiry.


Nb. Our comment from the 03/16/22 (Not published)


Nb. Our comment for 03/22/22


There are similarities with the rather odd FTSE here in the SPX, but not that many as it looks fairly conventional here at the moment.

Going back to last Wednesday, the rollover, we did see this index spend the majority of that day in or around its zone. Which back in the March expiry was at 4295-4305. Therefore, we are far more relaxed about what happened on the following Thu & Fri.

Worth noting though, that in March, Y2 started at 4405, and although the settlement price was just north of here, it wasn’t until this was out of the way before any significant gains happened on Friday.

What it did result in, especially as the zone here has been at 4395-4405 for quite some time, was that this index starts April in bullish territory.

This is very significant as it hasn’t been above its zone for a very long time.

In fact, just a stable zone would be a massive boon to the bulls.

All this looks very positive for this expiry, until that is we point out just how much minimal Y1 ratio there is.

This is important for two main reasons. Firstly, it means the zone is hardly establish, and so could move very easily, although this is equally true for either direction.

Secondly, with the Y1 ratio bandwidth coming in at 385 and the overall Y ratio bandwidth 610-points, these are some of the biggest numbers we have ever seen. And with so little ratio providing any sort of support or resistance by the naturally occurring dynamic delta, once this market realises this, it could go a very long way indeed with just the smallest impetus. It could also become very susceptible to whipsaw.

It looks ok for now, especially being in bullish territory, but don’t get fooled as 610-points is a 14% trading range, and that is in just four weeks.


Range:            4405  to  4580           

Activity:          Moderate

Type:              On balance bearish


The faction account of the Big Bang, The Great Storm and the market crash of 1987, available in eBook and paperback here, a must read if you don’t believe in history repeating itself.

Available to buy now

Posted in Uncategorized Tagged with: , , , , , , , , , , ,

March 21st, 2022 by Richard

Interesting zone placement in the FTSE April expiry, and with so much Y1 about this should make for a wild ride.


Nb. Our comment from the 03/17/22 (Not published)

Nb. Our comment on 03/21/22


For the record the FTSE spent the entire rollover Wednesday in its zone, so that was definitely job done. The Thursday and Friday are then just free to do what they want after that really.

Looking at the April expiry and we have to remind everyone that we just crunch the numbers and then try to interpret the results, so we have no control whatsoever as to what those numbers actually are.

We are pointing this out as it does look a very weird expiry.

First up is the fact the zone is 7550-7650 which, when you consider this market just a fortnight ago was battling it out with the ratio at 6950, is just a little odd.

It is basically as if the March expiry never happened.

Secondly, and probably as a direct result of the very high zone, there is a 400-point wide Y1 ratio bandwidth below it. That’s 5.4%, and this is just to start.

Obviously, the zone could easily move anywhere in this bandwidth, which might change the picture somewhat, but one thing that won’t change that quickly is that this is a huge expanse with absolutely minimal ratio in it.

Then when you add in the zone itself and the Y ratio above it, you are then staring at a possible trading range of 7150 all the way up to 7700, a staggering 550-points, or 7.4%. And this is a normal 4-week expiry, well not entirely normal as it expires on Thursday 14th due to the Bank Holiday.

Definitely going to be a fun trip this expiry, so best buckle-up tight.


Range:            7150  to  7550       

Activity:          Strong

Type:              On balance bearish

Available to buy now

The faction account of the Big Bang, The Great Storm and the market crash of 1987, available in eBook and paperback here, a must read if you don’t believe in history repeating itself.

Posted in Uncategorized Tagged with: , , , , , , , , , , ,

March 16th, 2022 by Richard

Amazing that R2 at 4165 held let alone the SPX is in its zone on the rollover.


Nb. Our comment from the 03/08/22


Well, we obviously got our move down in the zone, but it was not so cut and dried as we believed back on the 2nd.

Essentially, we saw some strength come into the ratios, so we didn’t actually see the move down until yesterday, the 7th.

This was a bit of a surprise, especially under the circumstance, but considering the intraday low last Friday 4th was 4284.98 (Y2 was 4295) and the close was 4328.87 meant that despite the bounce off this minor ratio level, without the zone actually moving down, it resulted in the fact it was still in bear territory.

This was a shame, as it sort of scuppered our hope of the market getting back into bullish territory.

Of course, on Monday when it did move down, the market did as well.

Although, it is not all bad news, as the ratios continue to show signs of strength below the zone.

And, in fact, there is no longer any Y1 below the new zone…and don’t forget last week this index bounced off Y2 not once but twice. However, considering what is happening in the world, we suspect this is not really something to depend upon.

But it is nevertheless a good sign (please see previous comments), as is the fact that the ratios here have strengthened enough for the Y1 ratio bandwidth to shrink to 160, although overall it remains at 360-points.

Here, we would like to point out our comments on the FTSE as they are just as true here, albeit the SPX is behaving, so far at least, far more rationally than we would ever have imagined.

So, at the end of the day, the SPX is now in the R1 ratio bandwidth, with R2 now a relatively short distance away, so this market will experience some dynamic delta futures buying for certain. What they make of it is an entirely different matter, but the recent precedent is at least promising.


Range:            4165  to  4245           

Activity:          Moderate

Type:              Neutral


Nb. Our comment for 03/16/22


Promising indeed…what an interaction with the ratio at 4165, and on the very day we published, the 8th March.

So, really, it couldn’t have turned out better for us, as not only did we highlight 4165, but the market spent over two hours finding this bottom (intraday low 4157.87), so it was very plain for all to see the dynamic delta in action, and in real time too.

Last week we also mentioned the FTSE and, for those in the know, they should have spotted the fact that while the UK was searching for its bottom with the ratio at 6950 so was the SPX with the ratio at 4165.

For the rest of last week, it was all about the zone and, in fact, the very next day, the SPX got as high as 4299.40, or to put it another way, the middle of its zone. Which in itself was a very impressive 135-point bounce, although perhaps these days we are getting numbed to such big moves.

Anyway, there was a bit of a tussle going on with whether or not the zone might make another downward move, to 4195-4205, which pretty much explains the price action on Thursday and Friday last week.

It is still a possibility, although at this stage of an expiry we would expect it to be far closer to being Y1 by now than it is.

So, perhaps a sort of outside hedge at best, or should that be worst?

As it is the rollover today, and as the market has bounced up to the zone, we couldn’t be happier. Especially as you couldn’t get a more strenuous test really.

We always say, that if the market is in or around its zone on the rollover, then that is job done and it has the next couple of days to do as it wants, but it is never as simple as that we acknowledge. Simply because it is just like giving a toddler a can of red bull and then expecting it to sit quietly, in this case in its zone.

And, sometimes, especially when its all been about support, you can lose sight of the fact that the R ratios above the zone don’t even start until 4605. So, we are glad it is here now, but with so much Y ratio still about, we very much doubt it will sit still.


Range:            4195  to  4295           

Activity:          Very poor

Type:              On balance only just bullish

The faction account of the Big Bang, The Great Storm and the market crash of 1987, available in eBook and paperback here, a must read if you don’t believe in history repeating itself.

Available to buy now

Posted in Uncategorized Tagged with: , , , , , , , , , , ,

March 14th, 2022 by Richard

7250 could be the level to watch for in the FTSE for the rollover and expiry this week.


Nb. Our comment from the 03/07/22

Well, we did say we could easily see a test of 7050 as, not only would that be in keeping with a triple, but under the present circumstances probably even more so.

The fact that this meant a tumble of just over 400-points, or 5.36%, meant that there was a huge amount of momentum inherent in the market, and obviously too much for the ratio at 7050 to cope with.

Although, having just said that, after the initial fall on Friday for most of the rest of the trading day the action did revolve around 7050, only capitulating in the final half hour.

And that is how the dynamic delta works, as the ratios just tell you where it is and how much of it to expect. What the ratios can’t tell you is the appetite of the market. So, at 7050 we know there will be a “DR” number of futures buying courtesy of the dynamic delta, what we don’t know is if this will be met by as many willing sellers.

However, generally we do get a feel for the market’s sensitivity, or an indication of how it will react to the levels of ratio, but under the current climate we can safely say that these are not normal times.

That said, the next ratio level coming up in the FTSE is B1 at 6950.

And as our levels are exponential, then this is a very significant number of futures buying generated by the dynamic delta. What we don’t know is whether this will be more than the market is willing to sell.

Under normal conditions we would have no hesitation in saying that this would be more than sufficient to turn the market but, with a war raging, who knows.

Finally, in the midst of all this excitement, it would be easy to miss the fact that the zone has slipped down to 7350-7450. This might not be so important in the next few days but, if any hint of normality returns, then it could become significant when we get closer to the rollover and expiry.


Range:            6950  to  7050       

Activity:          Poor

Type:              Bearish


Nb. Our comment on 03/14/22

What an absolutely epic battle with B1 the FTSE had.

And we must point out that on both Monday and Tuesday the actual open was 6890 and 6870 respectively, both being significantly below B1 at 6950, not the official 6987 and 6959.

Although on the Monday the market jumped 100-points straight up in just a few minutes such was the reaction to the dynamic delta unleased at the open.

Despite the deep incursion into B1, almost entirely down to huge gap downs at the open, the close on Monday was 6959.48 and on Tuesday 6964.11. Job done really.

Considering the gravity of the situation coupled with the obvious panic out there it was truly fascinating to watch how the market reacted to the dynamic delta and, naturally, we can’t not mention the SPX and their encounter with R2 at 4165.

Looking ahead, it is significant that the zone has fallen yet again and, it’s not beyond the possible that it might even return to where it started this expiry, at 7150-7250.

Although we have listed below the activity level as “moderate”, as this is a triple, where the numbers are just far far greater than an intermediary, this is actually very good. So, should this continue then there will no doubt be more changes.

It seems a very long time ago indeed when this index challenged R1 at 7550 north of its zone, the expiry high being on the very first day (21st Feb) at 7571.07 and again on the following Wednesday with the intraday high of 7549.98.

Therefore, considering how far this market has come back, and the nomadic nature of the zone, we think it will do well to hold the rollover and expiry in the Y ratio bandwidth. Although, we of course would like to see it end in its zone, but we have to be practical to a degree.

As 7250 is the current bottom boundary of its zone, which if it does return to its starting point, this would make 7250 the upper boundary, so in both scenarios we see this as a critical level this week.


Range:            7150  to  7250       

Activity:          Moderate

Type:              Bullish

The faction account of the Big Bang, The Great Storm and the market crash of 1987, available in eBook and paperback here, a must read if you don’t believe in history repeating itself.

Available to buy now

Posted in Uncategorized Tagged with: , , , , , , , , , , ,

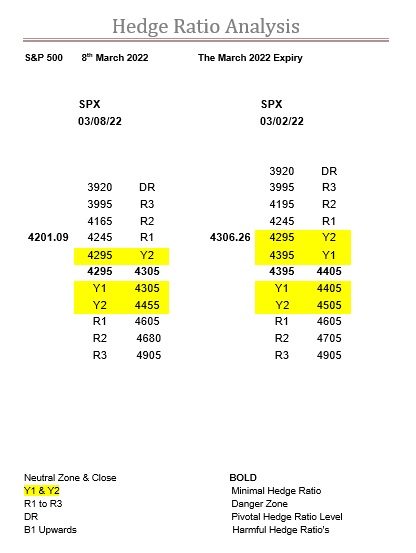
March 8th, 2022 by Richard

Has the SPX's zone bottomed out?


Nb. Our comment from the 03/02/22


The very reason we include our previous comment (above) is for easy reference and continuity. Therefore, following directly on from the test of R1 then at 4295 on the 22nd Feb we saw the market the very next day blast straight past that to R2, then at 4220, with the intraday low of 4221.51.

There is no denying that these were very nervous times so, for the ratios to have any affect at all, was very remarkable.

The day of the invasion the intraday low was 4114.65, just (again) twenty odd points above R3, but with the spike in the vega and the alacrity of the fall a bit of pre-emption was always very likely.

On the 25th Feb the zone moved down to 4395-4405, which is roughly where the market gravitated to but, very noticeably, it never tested the bottom boundary at 4395.

Yesterday, the 1st March, we saw the intraday low of 4279.54, when Y2 was at 4295.

And as we said last time “that it will respond to the dynamic delta is a good sign, as irrational fear (or greed) is never good” but as a triple expiry coupled with the fact there was so much Y ratio around it was always going to be extremely volatile even without the added issues of the invasion, so the fact that the ratios are even an influence can only be a good sign.

However, that’s pretty much where the good signs end, as the zone will almost definitely move down to 4295-4305, making the third downwards move in this expiry already.

Well, perhaps there maybe one more good sign, as if the zone does move down AND the market stays above 4305 then, by default, this market will find itself in bullish territory, and it has been a while since we have last seen that.

For the record the Y1 ratio bandwidth has shrunk from 260 to 210-points, and the overall Y ratio bandwidth from 435 to 360, so still ridiculously wide, meaning that even under normal conditions we would expect a trading range of at least 5% this expiry and yet, here we are, seven days in and the market literally hasn’t moved, albeit in a very exciting way.


Range:            4295  to  4395           

Activity:          Moderate

Type:              On balance decently bullish


Nb. Our comment for 03/08/22


Well, we obviously got our move down in the zone, but it was not so cut and dried as we believed back on the 2nd.

Essentially, we saw some strength come into the ratios, so we didn’t actually see the move down until yesterday, the 7th.

This was a bit of a surprise, especially under the circumstance, but considering the intraday low last Friday 4th was 4284.98 (Y2 was 4295) and the close was 4328.87 meant that despite the bounce off this minor ratio level, without the zone actually moving down, it resulted in the fact it was still in bear territory.

This was a shame, as it sort of scuppered our hope of the market getting back into bullish territory.

Of course, on Monday when it did move down, the market did as well.

Although, it is not all bad news, as the ratios continue to show signs of strength below the zone.

And, in fact, there is no longer any Y1 below the new zone…and don’t forget last week this index bounced off Y2 not once but twice. However, considering what is happening in the world, we suspect this is not really something to depend upon.

But it is nevertheless a good sign (please see previous comments), as is the fact that the ratios here have strengthened enough for the Y1 ratio bandwidth to shrink to 160, although overall it remains at 360-points.

Here, we would like to point out our comments on the FTSE as they are just as true here, albeit the SPX is behaving, so far at least, far more rationally than we would ever have imagined.

So, at the end of the day, the SPX is now in the R1 ratio bandwidth, with R2 now a relatively short distance away, so this market will experience some dynamic delta futures buying for certain. What they make of it is an entirely different matter, but the recent precedent is at least promising.


Range:            4165  to  4245           

Activity:          Moderate

Type:              Neutral

Available to buy now

The faction account of the Big Bang, The Great Storm and the market crash of 1987, available in eBook and paperback here, a must read if you don’t believe in history repeating itself.

Posted in Uncategorized Tagged with: , , , , , , , , , , ,

March 7th, 2022 by Richard

Huge Ratio level coming up in the FTSE.


Nb. Our comment from the 02/28/22

Apologies for not publishing last week, especially as we appreciate it might have been rather useful to know the ratio levels. In particular, that the zone at the start of this expiry was at 7200. Coincidentally, 7200 was the low and close on Thursday.

However, before this, the pertinent ratio level was R1 at 7550.

On Monday 21st the intraday high was 7571.07 before the market gave up just under 100-points.

Then on Wednesday 23rd it revisited it with the intraday high of 7549.98, before giving up 50-points.

The fact that the zone has moved up to its current position was always on the cards but, as we have mentioned previously, because triple witching expiries are so much bigger than the intermediaries then it’s like turning an oil tanker, very slow.

The problem the FTSE faces now, is that by leaving the move so late, it has left a vast swathe of the minimal Y ratio around, but especially below the zone.

And if this wasn’t bad enough, as triple expiries progress, they tend to get far less sensitive than intermediaries, so rather than reacting to R1 it would be entirely in keeping if March went on to test R3 or even higher levels.

And March still has three weeks to go, so we could easily see a range of 7050 all the way up to 7650, although it hasn’t done badly already, going from 7550 down to 7200 and back up again.

Probably be too big an ask to see it see this week out in its zone, but you never know.


Range:            7450  to  7550       

Activity:          Poor

Type:              Bearish


Nb. Our comment on 03/07/22


Well, we did say we could easily see a test of 7050 as, not only would that be in keeping with a triple, but under the present circumstances probably even more so.

The fact that this meant a tumble of just over 400-points, or 5.36%, meant that there was a huge amount of momentum inherent in the market, and obviously too much for the ratio at 7050 to cope with.

Although, having just said that, after the initial fall on Friday for most of the rest of the trading day the action did revolve around 7050, only capitulating in the final half hour.

And that is how the dynamic delta works, as the ratios just tell you where it is and how much of it to expect. What the ratios can’t tell you is the appetite of the market. So, at 7050 we know there will be a “DR” number of futures buying courtesy of the dynamic delta, what we don’t know is if this will be met by as many willing sellers.

However, generally we do get a feel for the market’s sensitivity, or an indication of how it will react to the levels of ratio, but under the current climate we can safely say that these are not normal times.

That said, the next ratio level coming up in the FTSE is B1 at 6950.

And as our levels are exponential, then this is a very significant number of futures buying generated by the dynamic delta. What we don’t know is whether this will be more than the market is willing to sell.

Under normal conditions we would have no hesitation in saying that this would be more than sufficient to turn the market but, with a war raging, who knows.

Finally, in the midst of all this excitement, it would be easy to miss the fact that the zone has slipped down to 7350-7450. This might not be so important in the next few days but, if any hint of normality returns, then it could become significant when we get closer to the rollover and expiry.


Range:            6950  to  7050       

Activity:          Poor

Type:              Bearish


The faction account of the Big Bang, The Great Storm and the market crash of 1987, available in eBook and paperback here, a must read if you don’t believe in history repeating itself.

Available to buy now

Posted in Uncategorized Tagged with: , , , , , , , , , , ,

March 2nd, 2022 by Richard

Very revealing how the SPX reacts to the ratios in a time of war.


Nb. Our comment from the 02/23/22


The February settlement price was 4383.70, so a little way below the zone (which finished at 4445-4455) but easily within the Y1 ratio, so as good as it was going to get.

Of course, US markets were closed on Monday, so this is only the second day of the first triple witching expiry of 2022, an expiry that was always destined to start life below its zone.

Which should have come as no surprise, as this market has been in bear territory for some time, on top of which the zone had started falling, having threatened to for so long.

So, with everything else going on, the overriding question was where, or if, this market would get some support.

As one can see in the tables above Y2 was 4390, last Friday as well as Tuesday, but has fallen today to 4345. Considering the market closed on Friday at 4348.87 this was a moot point anyway.

The real level to watch would have been R1, which has remained the same since last Friday. So, yesterday’s intraday low of 4267.11 gives us a very good insight as to what level of sensitivity exits in this expiry. And, although it did overshoot by twenty odd points, this is not disappointing because firstly, yesterday was the first day so the market naturally takes a bit of time to adjust, and secondly, it was always going to react to the geopolitical news and be playing catch-up with Europe.

The telling point was the close, back above R1.

Then, the fact R1 has remained at this level today is also reassuring.

It is by no means out of the fire yet, but as an early indication that it will respond to the dynamic delta is a good sign, as irrational fear (or greed) is never good.

Now, we just have to see how the ratio levels evolve, and as they are already dropping below the zone this is a bearish sign but, early days.


Range:            4295  to  4495           

Activity:          Poor

Type:              Neutral


Nb. Our comment for 03/02/22


The very reason we include our previous comment (above) is for easy reference and continuity. Therefore, following directly on from the test of R1 then at 4295 on the 22nd Feb we saw the market the very next day blast straight past that to R2, then at 4220, with the intraday low of 4221.51.

There is no denying that these were very nervous times so, for the ratios to have any affect at all, was very remarkable.

The day of the invasion the intraday low was 4114.65, just (again) twenty odd points above R3, but with the spike in the vega and the alacrity of the fall a bit of pre-emption was always very likely.

On the 25th Feb the zone moved down to 4395-4405, which is roughly where the market gravitated to but, very noticeably, it never tested the bottom boundary at 4395.

Yesterday, the 1st March, we saw the intraday low of 4279.54, when Y2 was at 4295.

And as we said last time “that it will respond to the dynamic delta is a good sign, as irrational fear (or greed) is never good” but as a triple expiry coupled with the fact there was so much Y ratio around it was always going to be extremely volatile even without the added issues of the invasion, so the fact that the ratios are even an influence can only be a good sign.

However, that’s pretty much where the good signs end, as the zone will almost definitely move down to 4295-4305, making the third downwards move in this expiry already.

Well, perhaps there maybe one more good sign, as if the zone does move down AND the market stays above 4305 then, by default, this market will find itself in bullish territory, and it has been a while since we have last seen that.

For the record the Y1 ratio bandwidth has shrunk from 260 to 210-points, and the overall Y ratio bandwidth from 435 to 360, so still ridiculously wide, meaning that even under normal conditions we would expect a trading range of at least 5% this expiry and yet, here we are, seven days in and the market literally hasn’t moved, albeit in a very exciting way.


Range:            4295  to  4395           

Activity:          Moderate

Type:              On balance decently bullish


Available to buy now

The faction account of the Big Bang, The Great Storm and the market crash of 1987, available in eBook and paperback here, a must read if you don’t believe in history repeating itself.

Posted in Uncategorized Tagged with: , , , , , , , , , , ,

February 28th, 2022 by Richard

The FTSE March expiry ratios need to settle.


Nb. Our comment from the 02/21/22 (Not published)

Nb. Our comment on 02/28/22


Apologies for not publishing last week, especially as we appreciate it might have been rather useful to know the ratio levels. In particular, that the zone at the start of this expiry was at 7200. Coincidentally, 7200 was the low and close on Thursday.

However, before this, the pertinent ratio level was R1 at 7550.

On Monday 21st the intraday high was 7571.07 before the market gave up just under 100-points.

Then on Wednesday 23rd it revisited it with the intraday high of 7549.98, before giving up 50-points.

The fact that the zone has moved up to its current position was always on the cards but, as we have mentioned previously, because triple witching expiries are so much bigger than the intermediaries then it’s like turning an oil tanker, very slow.

The problem the FTSE faces now, is that by leaving the move so late, it has left a vast swathe of the minimal Y ratio around, but especially below the zone.

And if this wasn’t bad enough, as triple expiries progress, they tend to get far less sensitive than intermediaries, so rather than reacting to R1 it would be entirely in keeping if March went on to test R3 or even higher levels.

And March still has three weeks to go, so we could easily see a range of 7050 all the way up to 7650, although it hasn’t done badly already, going from 7550 down to 7200 and back up again.

Probably be too big an ask to see it see this week out in its zone, but you never know.


Range:            7450  to  7550       

Activity:          Poor

Type:              Bearish


Available to buy now

The faction account of the Big Bang, The Great Storm and the market crash of 1987, available in eBook and paperback here, a must read if you don’t believe in history repeating itself.

Posted in Uncategorized Tagged with: , , , , , , , , , , ,