Category: Uncategorized
March 27th, 2018 by Richard

SPX , NDX & DJX Ratio Table 27th March 2018
When we last looked at the SPX it was right on R2 which was then at 2645 and the market closed at 2643.69.
It did actually open up 3-points that Friday so the warning was when it couldn’t hold it, and the next level was R3 at 2595, or a bit lower as we didn’t calculate the ratios on that day.
However, as you can see from today’s table they are all easier below the zone, which is in keeping with how they have been moving so far this expiry.
The low on Friday was 2585.89 incidentally, and today R3 is 2570.
And just like the DJX Monday’s rally now sees this index back into the Y ratio bandwidth.
However, the zone has also fallen here and with the ratios stronger above it and weaker below it these are all bearish signs, so at the moment it is a bounce off high ratio levels but no mistake we are still in a bear market.
Range: 2645 to 2695
Activity Very good
Type: On balance only just bearish
[affilinet_performance_ad size=468×60]
Whether it is our ice-rink analogy or warning to hang on tight in the NDX the sad fact is nothing has actually changed.
Well, nothing pertinent that is.
Sure, the zone has narrowed, but the levels haven’t changed and it is still all completely Y ratio.
The disturbing aspect is that nothing has changed apart from the addition of a further 24 strikes, which is on top of the 28 previously, so seriously why bother when it enhances nothing. Surely if someone requests it then does zip, they and it are pointless?
Range: 6375 to 6775
Activity: Average
Type: Neutral
[affilinet_performance_ad size=468×60]
To be fair in these circumstances we really should be calculating the ratios daily the changes are so frequent.
Anyway, at least it reveals a huge degree of engagement, as more often than not these types of markets can get everyone running for the hills.
Activity is still high, the zone has dropped again, but the close back inside the Y2 ratio bandwidth makes today just as critical as all the others so far this expiry.
When we last looked at the DJX the Y ratio bandwidth below the zone stretched from 24800 all the way down to 24000, and Thursday’s close at 23957 was in hindsight a warning as that made the next support DR.
At 24000 it leapt to R3, and at 23700 it was DR, so that is a lot of futures buying, and no denying fundamentals were in charge, but to go that far Monday’s reaction was always a possibility.
Range: 23600 to 24000 or 24000 to 24600
Activity: Strong
Type: On balance fractionally bearish
[affilinet_performance_ad size=468×60]
Posted in Uncategorized
March 23rd, 2018 by Richard

SPX, NDX & DJX Ratio Table 23rd March 2018
Exactly as we said “so it certainly won’t be dull” and right away the SPX on that Monday went all the way down to test Y2 at 2695, the low being 2694.59.
The fact it bounced off Y2 revealed a high degree of sensitivity and the next couple of days were spent just meandering around within its Y1 ratio bandwidth.
The trade war definitely put fundamentals in the driving seat and significantly it went past R1 at 2670.
But just as significantly the close was right on R2, which now becomes the critical level in much the same way 7050 was in the FTSE.
Range: 2595 to 2645 or 2645 to 2670
Activity Good
Type: On balance bearish
[affilinet_performance_ad size=468×60]
Also, as we said in the NDX “So, hang on tight as with no, or extremely little, dynamic delta we are now in the middle of a huge frozen lake on razor sharp ice-skates where even the slightest puff of wind could blow the market a very long way”.
However, it was not so much a “puff” of wind but a full-on Trump trumpet which has seen this index drop 337.69-points, or 4.81% in as many days.
The zone has narrowed, slightly, the Y2 levels have come in, on top of which they have added almost 30 strikes, so there is interest, but where one says “from the ground up” this expiry has only just about finished the foundations.
Range: 6375 to 6775
Activity: Very strong
Type: On balance bearish
[affilinet_performance_ad size=468×60]
The DJX on Monday the first day of this expiry -yes folks we have another 4-weeks of this- was the other index to test their Y2 level, getting as low as 24453 when it was at 24400.
Again, a good recovery but nothing very spectacular.
However, significantly the close yesterday was 23957, which is below R3, which is also the first R ratio this market has encountered.
Like Monday one can’t read too much into 40 odd points on such a large index, especially when it comes on the back of a substantial move, but it does leave 24000 as a very significant level.
There has also been a small change in the zone, and several changes in the levels, as one would expect on very decent activity.
Range: 23700 to 24000 or 24000 to 24800
Activity: Strong
Type: On balance only just bearish
[affilinet_performance_ad size=468×60]
Posted in Uncategorized
March 22nd, 2018 by Richard

FTSE & DAX Ratio Table 22nd March 2018
Coincidentally when we last looked at the FTSE the close was at this very same level, well 4-points above it to be precise, but close enough.
However, you couldn’t get two different closes, which really only becomes apparent when one realises the significance of 7050.
Basically, Monday’s close was last minute whereas yesterdays was early on and very much by design, as Tuesday had revealed the bulls hand by their attempt to get above 7050, so the bears knew what had to be done and basically did it.
The fight back to get back to 7047 before the close also shows the bulls have not retreated very far.
7050 obviously remains critical, and 7100 remains R2 by the skin of its teeth, so if the bulls go for it then the zone would be the next target with every possibility of seeing a test of 7350, or R2, this expiry.
So, a lot to play for, and on the downside, DR is now just 80-points below, so best to be prepared.
Range: 6950 to 7050 or 7050 to 7100
Activity: Very good
Type: On balance bearish
[affilinet_performance_ad size=468×60]
The DAX in a word, sedate.
After Monday’s excitement, when it never even tested their Y2 level, unlike the DJX and SPX, it has recovered enough to knock on the bottom zone boundary door with the high of 12344.
It is the first week of a five-week expiry so this response is perfectly normal, but if it does get excitable then don’t forget it is still in a 300-point wide Y1 ratio bandwidth, and that’s just below the zone as well, so it could easily start motoring.
Range: 12050 to 12350
Activity: Good
Type: Neutral
[affilinet_performance_ad size=468×60]
Posted in Uncategorized
March 20th, 2018 by Richard

FTSE & DAX Ratio Table 20th March 2018
Monday was a tremendously aggressive start to the expiry for the FTSE considering it actually started inside its zone.
However, this was only just and it was probably more about damage limitation in March, underlined by the settlement price being right on one of our levels 7150.63.
The market blasted down through 7100, which as this was R2 it appropriately caused the brakes to come on.
However, it was in the final half hour and the close below R3 at 7050 that is more of a concern.
It is the first day, so still finding its feet, and it was right at the end of the day and furthermore by just a few points, but it is nevertheless below it.
So, a huge start today for London and obviously 7050 is crucial as the next support is not until DR at 6950.
Range: 6950 to 7050 or 7050 to 7100
Activity: Very good
Type: On balance just bullish
[affilinet_performance_ad size=468×60]
The DAX opened down 43-points, right on its zones bottom boundary, then tried to recover but just couldn’t hold on to it.
R1 is a lot closer now than when we last looked at the DAX April expiry, but there is still 600-points of Y ratio between it and the zone, so yesterday’s 172-points is actually quite reserved.
The fact there is still 400-points of Y ratio still above the zone, not too mention the zone itself, means we could be in for a fantastic expiry.
Range: 11950 to 12350
Activity: Strong
Type: Neutral
[affilinet_performance_ad size=468×60]
Posted in Uncategorized
March 19th, 2018 by Richard

SPX , NDX & DJX Ratio Table 19th March 2018
Whether or not March’s zone moved in time to match April’s is immaterial now, but with the settlement price of 2751.83 it was certainly as if it had.
Of course, this means this expiry starts with the market in its zone, so literally everything to play for.
As March only went as high as DR it is not surprising April can only manage R3, so with it remaining ratio thin hopefully sensitivity will increase proportionally.
At the least we would expect it to trade between the R1 ratio levels, so for this long 5-week expiry that is 2680 all the way up to 2805, so it certainly won’t be dull.
Range: 2745 to 2755
Activity Average
Type: Bearish
[affilinet_performance_ad size=468×60]
As the appearance of R1 with just days to go, and it also being 300-points away, for us gives March the dubious accolade of being the first Y ratio only expiry.
However, it could be a very short reign as we drop down to the intermediary April which is also a 5-week one.
In fact, it already gets the also dubious accolade of having the widest ever zone, being 150-points, which just goes to show exactly how little ratio there is.
So, hang on tight as with no, or extremely little, dynamic delta we are now in the middle of a huge frozen lake on razor sharp ice-skates where even the slightest puff of wind could blow the market a very long way.
Range: 6925 to 7375
Activity: Very good
Type: Neutral
[affilinet_performance_ad size=468×60]
When we last looked at (March) DJX we said it was still possible for that zone to move to 24900-25100 and judging by the settlement price it did just that.
The final price was 24879, so just a smidgen shy, but as April’s has obviously also moved to this level then this suggests both did.
So, judging by the closing price being in its zone then both the DJX and SPX are in a very similar position this expiry, actually practically identical.
However, here the R ratios go from 24000, where it is not messing around as it kicks off at R3, all the way up to 25300, so also plenty to play for, the only question is which way will it jump first?
Range: 24900 to 25100
Activity: Very strong
Type: On balance just bullish
[affilinet_performance_ad size=468×60]
Posted in Uncategorized
March 15th, 2018 by Richard

DJX March to April ratio rollover table 15th March 2018
When we last looked at the DJX on 8th March we were rather hoping it was moving to being on the same page as the SPX.
Although on our last look at the SPX we were again anticipating a move higher in their zone which hadn’t actually materialised and by the end of that Tuesday it was too late as the SPX hit R2 at 2805 and the DJX walloped into it here at 25400 (high 25376).
Must have come as bit of a shock as well because the last time it hit R2 it was at 25800 when this index actually hit 25800 on the 27th February.
Anyway, this index turned around 429-points and as the zone here hasn’t changed either then no real surprise the DJX is now back in the driving seat having ousted the SPX.
With a day to go anything can happen, and the zone moving to 24900-25100 here is still entirely possible, but even if it doesn’t we are only talking Y1, albeit there is an awful lot of it, so not that painful really.
Range: 24600 to 25400
Activity: Poor
Type: On balance not bearish
[affilinet_performance_ad size=468×60]
There are three stand-out aspects to April.
Firstly, the zone, being 25100-25300 it is already showing March where they should be.
Secondly, no disproportionately large positions.
Finally, below the zone it jumps straight to R3 from the Y ratios.
Still an enormous amount of Y ratio around so these decent moves should continue.
Range: 24400 to 25100
Activity: Average
Type: Neutral
[affilinet_performance_ad size=468×60]
Posted in Uncategorized
March 15th, 2018 by Richard

DAX March to April Rollover 14th March 2018
Considering what it has had to contend with the DAX has done remarkably well.
Very little change in the ratios since we last looked on the 9th March, which is significant as then we thought those large put positions may be starting to be unwound, but evidently not anymore so far.
Therefore, for this index to get back to testing the bottom of its zone, not once but twice, is very impressive, lodging highs of 12454 and 12459 over the last two days.
Of course, next visit would be strike 3 but we suspect it will need a fair wind from the US, and all the while the clock is ticking.
Don’t forget this index spent more than the first week safe in its zone, then bounced off R2 when it was at 12150, then went deep into R3 courtesy of an opening gap down when that was at 11950, so it knows what is where roughly, but 500-points of Y ratio in-between makes for very volatile conditions in the meantime.
Range: 11950 to 12450
Activity: Only just registered
Type: Bullish
[affilinet_performance_ad size=468×60]
In April the most startlingly obvious aspect is no large inherited positions before the start of this becoming the alpha expiry.
So, we are back to mentioning that the DAX can be a slow starter, but even so this is thin, so it is evidently falling prey to the fact this is a 5-week expiry as well as an intermediary.
Therefore, if it doesn’t populate with some ratios the fun and games we are having in 500-points of Y ratio below the zone in March will be proportionately magnified as here there is 900-points, and if you include above the zone and it itself then one is staring at 1500-points.
Range: 11450 to 12350
Activity: Average
Type: Neutral
[affilinet_performance_ad size=468×60]
Posted in Uncategorized
March 14th, 2018 by Richard

NDX March to April Rollover 14th March 2018
To be honest we are a little disappointed in the NDX, although perhaps not for the obvious reasons, but rather the fact that at the very last knockings R1 has appeared.
Essentially this takes away the record, which would have been for the least ever ratio populated expiry, or in other words an entire expiry with only Y ratio.
However, the fact it has come in at 7300 means it hardly qualifies in our estimation being so OTM.
Although at the end of the day it does explain why this index, which closed at 6770.66 at the end of the last expiry (Feb), has been on a colossal 415.43-point journey in the last 4 weeks, an impressive 6.14%.
Range: 6825 to 7100
Activity: Moderate
Type: On balance bearish
[affilinet_performance_ad size=468×60]
Even if March had got the record, which it probably has, then we suspect it would not have been for long as not only is April an intermediary but it is also a 5-week long expiry.
And if it took March until week 4 to start adding strikes (20 odd for the record) then April is looking good for the first expiry in an exceedingly long time to start without a single added strike.
If this index continues to be unloved and ignored then March’s journey could prove to be just a gentle warm-up with only Y1 present and even the zone is 75-points wide the ratios are so low.
Range: 6850 to ….
Activity: Average
Type: Neutral
[affilinet_performance_ad size=468×60]
Posted in Uncategorized
March 13th, 2018 by Richard

SPX March to April Rollover 13th March 2018
When we last looked (8/03/18) at the SPX we were anticipating a move up in the zone and said under the right conditions even “2800 could easily be on the cards.”
So, the 47.60-point move up last Friday should not have held any surprises, perhaps a touch early but it certainly sets the stall out for this week, which is what it is all about after all.
No change in any of the ratios above the zone whereas below it we lose R1, so really all we are lacking is that move up in the zone.
The levels we mentioned last week are certainly still more than likely, but as a rank outsider 2795-2805 is coming up on the outside, which is worth noting.
Range: 2755 to 2805
Activity: Moderate
Type: On balance only just bearish
[affilinet_performance_ad size=468×60]
One glance and you can tell in April we are back to an intermediary expiry.
In fact, as a triple March was rather underdeveloped, as revealed by no B ratios at all, so by default this expiry will struggle.
Nevertheless, the zone here has already shifted, and this should be a good indication for where March should be.
Otherwise the Y ratios stretching from 2670 all the way up to 2830, a truly massive 160-points, shows we could be in for a real rollercoaster ride.
Range: 2755 to 2830
Activity: Average
Type: Neutral
[affilinet_performance_ad size=468×60]
Posted in Uncategorized
March 13th, 2018 by Richard
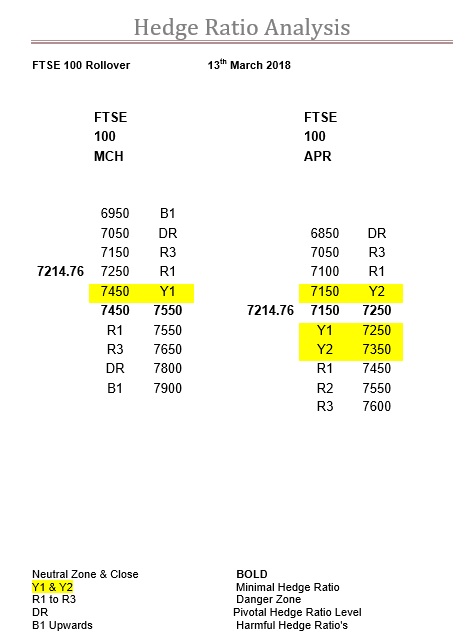
FTSE March to April Rollover Table 13th March 2018
We have only just looked at the FTSE (Fri 9th March) so not a lot will have changed, although being the rollover one could argue everything has now changed.
Last Thursday we saw the low of 7145.70 which was a test of R3 at 7150 and which remains unchanged.
Yesterday we saw the high of 7254.87 which was a test of R1 and which was R2 on Friday, but very much expected to drop.
Nevertheless, the above table just goes to show how important 7250 actually is, as get above it and the market is in Y1 ratio, with the draw of the zone 200-points above.
More than likely there will be a compromise, and more than likely on a spike in activity, but it should still be fun, if it can get above 7250.
Range: 7150 to 7250
Activity: Poor
Type: Bullish
[affilinet_performance_ad size=468×60]
At first blush April looks like it may be a major problem for March, the zone here being 7150-7250, where the market is now of course.
So, it could all just boil down to March bossing the expiry, which it should do and the fact it’s a triple going up against an intermediary all the more so.
If it does then it is worth noting that in April the minimal Y ratios do actually stretch all the way up to 7450.
However, it does add weight to the importance of 7250.
Range: 7150 to 7250
Activity: Average
Type: Neutral
[affilinet_performance_ad size=468×60]
Posted in Uncategorized
