Category: Uncategorized
March 9th, 2018 by Richard

FTSE & DAX Ratio Table 9th March 2018
On Monday 5th March we took pains to point out in the FTSE that B1 was now 7050 so as the low that day was 7062.13 we will take that as a hit all day long.
Actually, on Monday we also pointed out that the zone could easily move to where it now has, 7450-7550.
Yesterday the market closed 150-points up from B1 but more importantly survived numerous attempts on what was DR but is now R3 at 7150, which is bullish.
It is now in the R2 ratio bandwidth between 7150 and 7250 but we must point out that this is only just above the threshold, and so by the end of the day will more than likely be R1.
Still with the zone now so far ahead next week could be a classic, so buckle-up.
Range: 7150 to 7250
Activity: Poor
Type: Bullish
[affilinet_performance_ad size=468×60]
It would have been nice for the DAX to hit one of our ratio levels before bouncing, but the trouble here is their open can cause big gaps before the dynamic delta can kick in.
This was just such a case on Monday 5th March when it opened down 82-points at 11831, deep into R3, hit the low of 11830 and has never looked back since.
A huge chunk of those impressively large put positions we highlighted in this expires rollover week (mid Feb) have now been undone, but this has happened while there has also been some impressive call action.
Now just shy of its zone, which it hasn’t been above so far this expiry, means all to play for, and the goal posts may have shifted as well.
Range: 11950 to 12450
Activity: Average
Type: Bullish
[affilinet_performance_ad size=468×60]
Posted in Uncategorized
March 8th, 2018 by Richard

SPX , NDX & DJX Ratio Table 8th March 2018
It has only been a day since we last looked at the US but as the rollover starts next week we thought we would get one last look at the mighty March in this format.
As one can see in the SPX there hasn’t been a great deal of change in the ratios, and what there has been is more of an alignment or establishing uniformity.
This index (and the DJX) visited its zone yesterday, and spent some time there, so finishing back above it is significant and bullish.
And as we forecast, the troubles of the week before were caused by the DJX, as here in the SPX it remains a bullish outlook, in fact so much so we would fully expect to see the zone move to 2720-2730, and there is even the chance it may jump to 2745-2755.
After Tues high of 2732.08 and yesterday’s 2730.60 then if it goes back today this would be strike 3 of Y2 and hence why it is not included in our trading range today.
If it gets its way, which will depend on the DJX, and (big and) the ratios start receding then 2800 could easily be on the cards.
Range: 2705 to 2755
Activity Poor
Type: On balance only just bearish
[affilinet_performance_ad size=468×60]
The NDX didn’t even join the other two in visiting its zone yesterday, so perhaps not as correlated as it was last week.
At the end of the day it still has no R ratios and therefore can do what it pleases as for a normal expiry it’s a stretch to be sensitive to Y2, but for a triple this is even more unlikely.
It could be historical achieving an entire expiry without developing a single R ratio, and doing that in a triple is even more impressive, but also sad.
Range: 6875 to 6925
Activity: Moderate
Type: On balance bearish
[affilinet_performance_ad size=468×60]
There have been no changes at all in the DJX’s ratios over the last two days.
Interestingly this is despite this level of activity, which although not high up on the scale for a triple witching expiry this is still a considerable amount.
The trouble here is that it hit R2 at 25800 then collapsed all the way down to R1 at 24200 and then finished in the middle of its zone all in one week.
So, it took 5 days to do what it should have taken 4 weeks to do, so not surprisingly they are probably thinking what else can we do.
The fact activity is what it is, and with a helping hand from the SPX, and if everything aligns then we could also see the zone here moving to 24900-25100, so this index may now actually be on the same page as the SPX.
Range: 24600 to 25400
Activity: Moderate
Type: Bullish
[affilinet_performance_ad size=468×60]
Posted in Uncategorized
March 6th, 2018 by Richard

SPX , NDX & DJX Ratio Table 6th March 2018
The last 4 days since we published has been all about synchronicity.
Here in the SPX we left it at 2713.83, which was just above its zone, having collapsed 65-points from being in its R1 ratio bandwidth, which was at 2765 back then.
It left its zone in its wake on Thursday, which was due to the DJX (please see below), closing at 2677.67.
Friday was this index’s big day as it got as low as 2647.32 for a test of the corresponding R1 below the zone at 2645.
The degree of sensitivity is a bit exaggerated as it was most certainly a joint effort with the DJX, but there is no denying R1 at both ends is proving potent.
Importantly though it finished just 3.75-points shy of its zone, which is very close considering the magnitude of the move and that the target is just a mere 10-points wide.
The most important aspect on Monday was the high of 2728.09, or Y2 (2730), which may well signal an increase in sensitivity or just plain exhaustion.
Range: 2705 to (2730) / 2755
Activity Poor
Type: Neutral
[affilinet_performance_ad size=468×60]
The trouble with the NDX is that it just simply doesn’t have any R ratios.
And this is week 3, so it is very unlikely to do so now, unless the big players wade in although we haven’t seen them for quite a while and it would be impressively brave.
It does want to be a part of it all the same as their close on Friday at 6811.04 put them fairly close to the middle of their zone, so there is a degree of tracking going on.
Range: 6875 to ….
Activity: Moderate
Type: On balance bearish
[affilinet_performance_ad size=468×60]
The DJX has been the main issue since we last looked at it on Wednesday 28th Feb.
Back then it had just hit R2 at 25800, the high being exactly 25800, but more importantly their zone had just reverted back down to 24400-24600.
This move in the zone proved critical as the low on the Thursday was 24442, which would ordinarily be a little bit above what we would call a test of the bottom boundary, but as this came at the end of a 743-point move with the corresponding jump in the Vega we are more than happy to call that a test.
The crux came on the Friday when it got as low as 24217, under quieter circumstances for sure, but again we have no problem calling that a test of R1 at 24200 (nb. Today R1 is 24300).
The main point being is that on Friday at about the same time this index and the SPX both hit R1 and bounced considerably.
However, here they went on to test their zones upper boundary (high 24592) before finishing near to the middle of it.
Monday saw a test of their zones bottom boundary, low 24387, before breaking out above it where there is still a lot of Y1, but after a 1600-point journey between its R ratios it must be exhausted as well.
Range: 24600 to 25400
Activity: Very poor
Type: On balance bearish
[affilinet_performance_ad size=468×60]
Posted in Uncategorized
March 5th, 2018 by Richard

FTSE & DAX Ratio Table 5th Feb 2018
It has certainly been an interesting week for the FTSE and when we last published (Monday 26th Feb) we were looking for it to get back into its zone.
And the first two days of last week were all about that, so much so it looked to us very relaxed and happy being in there.
Wednesday changed all that, although it did put up a stalwart fight, only losing in the closing half hour, and really because of the weakness from the US.
Up until today there has been no change to the ratios below the zone, so on Thursday the next level of support was DR at 7150, which it hit, with the low of 7153.39 before closing at 7175.64.
This is not only important to gauge how the market reacted to the dynamic delta at this level, but also as it helps to explain Friday.
Officially the open was the previous day’s close, 7175.64, but in the real world it was nearer 7100 after the Street’s continued big losses, so easily below this DR level.
On Friday B1 was at 6950 and so the change today is the first below the zone all week.
Worth noting the low and close on Friday was 7063.42.
On top of this, quite literally, however are the huge changes in the ratios above the zone, the most significant being the appearance of Y1.
So, if it gets a fair wind from the other exchanges it is looking very good for the FTSE, in fact we could even see a big jump up in the zone, and quite possibly to 7450-7550, which would make for a very exciting end to this expiry in two weeks’ time.
Range: 7050 to 7150
Activity: Moderate
Type: Bearish
[affilinet_performance_ad size=468×60]
If anyone was in any doubt regarding the opening weakness in the markets of Friday here in the DAX they began with a loss of 139-points.
And very shortly after that it went straight down to R3 at 11950, which eventually yielded but only after a very decent battle.
And rather ironically the DAX is now in the same position, almost, as London, but from a totally different starting point, and also here all the ratio changes are below the zone rather than above it like the FTSE.
This index was already happily within its zone on our last analysis, and had been for some time, but it was for the same reasons it broke down out of it on Wednesday, and then only by 15-points, hardly anything.
This in itself was a little surprising, as on the Tuesday the high on the DAX was 12577 and the low 12436, which was a classic zone bandwidth test, so a breakout the next day was only to be expected.
However, on Thursday the low was12143, and if you check back to Monday’s table you will see R2 was at 12150 before closing at 12190.
However, on Friday it has gone altogether, leaving the next line of support at 11950.
March is quickly turning into a typical triple witching expiry where it is normal for it to take on the higher levels of ratio, and even better we are just at the halfway point.
Worth taking note of, as this index is far more correlated to the US, that the DJX hit R1 at 24200 on Friday (low 24217) as did the SPX, with their R1 level being at 2645 (low 2647.32).
Furthermore, both the DJX and NDX closed inside their respective zones, having bounced very nicely, and the SPX was just 3.75-points shy of their bottom boundary.
Talk about synchronicity.
Range: 11750 to 11950 or 11950 to 12250
Activity: Moderate
Type: Bullish
[affilinet_performance_ad size=468×60]
Posted in Uncategorized
February 28th, 2018 by Richard

SPX , NDX & DJX Ratio Table 28th Feb 2018
It has been a week since we last published the SPX ratios, and surprisingly little has changed.
Below the zone (which itself is unchanged), as that is the simplest, although it has strengthened it is not by much, and let’s face it, it had plenty of scope, and still no B ratios, which for a triple is a bit weird.
Above the zone they are very weak, in fact not only do we now see Y1 but this also means the distinct possibility of a rise in the zone.
The market is back into the Y ratio bandwidth so expect volatility, and the break out of its zone was only last Friday, so it’s not really that aggressive, and with the high (so far) this expiry of 2780.64 it seems to be having difficulty with just R1, but early days still and if no shocks from the other two this index is looking very bullish.
Range: 2705 to 2765
Activity Poor
Type: On balance only just bearish
[affilinet_performance_ad size=468×60]
The NDX seems almost forgotten about this trip as there has been absolutely no change in the ratios at all over the last week.
The fact it was in its zone, and also like the SPX, breaking free last Friday, and it has already been above Y2 at 6875, incidentally on the same day, means there is nothing left for it to be sensitive too.
The fact it has remained totally unchanged and yet has produced the highest activity of all three is more than likely because of the fact there was so little there from the start, but nevertheless it looks like a straightforward fist fight between the other two.
Range: 6875 to ….
Activity: Average
Type: On balance only just bearish
[affilinet_performance_ad size=468×60]
The DJX in total contrast has been very busy on the ratio front over the last week, and the one most likely to rain on the SPX’s parade.
Today is critical because as you can see the market closed right on R1 at 25400.
Incidentally the high yesterday was 25800, which is no coincidence.
The massive change here is that the zone is back down to 24400-24600, so where the market sits now is right on top of a Y1 ratio bandwidth that stretches all the way down to the zone.
Seriously big decision for this index now, and one that will affect the others no doubt.
Range: 24600 to 25400 or 25400 to 25800
Activity: Moderate
Type: On balance bullish
[affilinet_performance_ad size=468×60]
Posted in Uncategorized
February 26th, 2018 by Richard
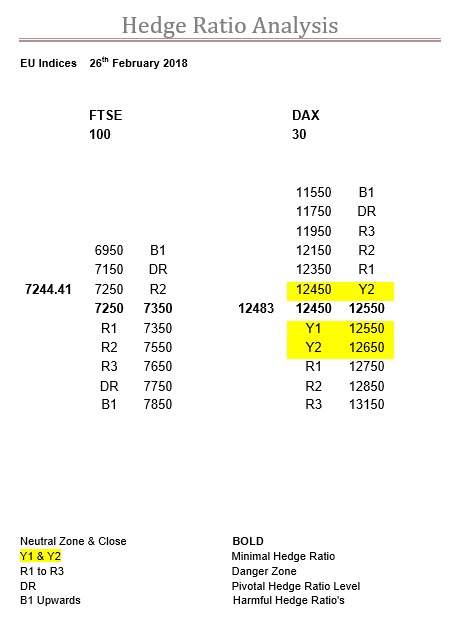
FTSE & DAX Ratio Table 26th Feb 2018
We last looked at the FTSE on Wed 21st and then it was all about R3 at 7200 and the bottom of the zone at 7250.
On that day it closed back inside its zone at 7281.57 but a nigh on 500-point wobble on the DJX knocked it straight back to R3.
The first test was early morning of course but it recovered well before testing it again fearing another weak Street, and on both occasions getting as low as 7190.
Friday it never went back to R3 at 7200, which is significant, but also didn’t quite manage to hold onto the zone at 7250, ending up closing just below it.
Today below the zone it is very straightforward now, but early on the market won’t know R3 has gone so it may still be effective, otherwise it’s obvious to us it really wants to get back in its zone, so the only question is whether the others will let it?
Range: 7150 to 7250 or 7250 to 7350
Activity: Poor
Type: On balance only just bearish
[affilinet_performance_ad size=468×60]
Similarly, our last look at the DAX had it in its zone, in fact the close last Tuesday to this Friday’s close is a change of only – 4-points (nb. The FTSE is – 2.36-points).
However, the story here is the tests of R1 at 12350 it has had, but probably more importantly, survived from.
Again, this index to us looks happy to be in its zone, but nevertheless can’t help having nervous glances over its shoulder to see what the US is doing.
The big change here is the strength in the ratios above the zone, still very lopsided but at least not by quite as much now.
Range: 12450 to 12550
Activity: Moderate
Type: On balance bullish
[affilinet_performance_ad size=468×60]
Posted in Uncategorized
February 21st, 2018 by Richard

SPX , NDX & DJX Ratio Table 21st Feb 2018
We last looked at the SPX on Tuesday 13th and in the March expiry surprisingly little has changed, but of course they were closed on Monday.
Nevertheless, below the zone its unchanged whereas above the ratios have all strengthened.
The main stand out aspects of this expiry at the moment are that there is an awful lot of Y ratio still present for a triple witching, and that how uniform they are either side of the zone.
All staggeringly neutral and unopinionated not to mention a tad boring.
Range: 2705 to 2755
Activity Moderate
Type: On balance bearish
[affilinet_performance_ad size=468×60]
Slightly remiss of ourselves as we last looked at the NDX on the 8th February, and so not at all over the rollover and expiry period.
We normally publish our ratio table before the market opens so all we can say is that in the Feb expiry in this index R2 was at 6375 on 6th Feb and the market having given up 264.37-points the day before to finish at 6495.92 went as low as 6370.48 before finishing that day ay at 6665.98.
Then on the 8th Feb R2 had fallen to 6175 and the day after on the 9th the expiry low was 6164.43.
As one can see March is still very underdeveloped so hopefully it will return to being sensitive to Y2, but as it stands it is safe within its zone.
Range: 6775 to 685
Activity: Average
Type: Neutral
[affilinet_performance_ad size=468×60]
Our last look at the DJX was on Wednesday 14th when it had just closed at 24640 the day before and we mentioned it would actually make for the perfect expiry if it got back to its zone (25000-25200) by Friday.
On Friday the expiry was 25167 which was plain and simple the icing on the cake.
It closed at 26071 on the last day of the Jan expiry, and in the Feb expiry it went up to B1 at 26600 on the 26th Jan with the high of 26616, then plummeted all the way down to DR at 23800 on the 6th Feb with the low of 23778, but please note 23800 was B1 just the day before.
So, 545-points up to B1, 2838-points down to the corresponding B1 followed by a recovery of 1389-points to expire in the zone.
An awe-inspiring round trip of 4772-points or 18.3% and all within a single 4-week expiry, marvellous.
Looking at the table above for this expiry, and March is the first big one of the year, and it only goes up to R2, so dare we speculate we are back to normal?
Range: 24300 to 25100
Activity: Good
Type: On balance bearish
[affilinet_performance_ad size=468×60]
Posted in Uncategorized
February 21st, 2018 by Richard

FTSE & DAX Ratio Table 21st Feb 2018
Huge changes in the FTSE, which considering the mess it got into in Feb this is not unexpected.
Evidently the close on Monday at 7247.66 was significant, as yesterday’s high of 7264.78 and low of 7202.14 highlights the fact this index was trapped in the very narrow R2 ratio bandwidth.
Obviously both levels are now of major importance, but the points to identify are that DR kicks in at 7150, whereas going the other way, if it can get above 7250, then it is back into its zone with no ratio at all in its way all the way up to 7350.
Range: 7200 to 7250 or 7250 to 7350
Activity: Average
Type: On balance bullish
[affilinet_performance_ad size=468×60]
We last looked at the March DAX back on the 14th during the rollover and surprisingly little has changed.
Virtually nothing below the zone but above it the ratios have filled in, as this time last week they only went as high as R1 and then this was not until 13050.
However, since the close on Friday this index has not gone far from its zone, so exciting it may have been, but ultimately just treading water.
Nevertheless, it is difficult to escape from the fact there is still a lot more supportive ratio below the zone than any above it creating resistance, but being in its zone it still has plenty of scope either way.
Range: 12450 to 12550
Activity: Very good
Type: On balance only just bullish
[affilinet_performance_ad size=468×60]
Posted in Uncategorized
February 16th, 2018 by Richard

FTSE Feb to Mch Rollover 16th Feb 2018
The FTSE has been a real mess this expiry, however having said that it really was a case of just extreme bad timing.
The start of the expiry was perfect as it hit R1 at 7750 (high 7745.22 23rd Jan) which made the corresponding R1 ratio at 7500 the target with perhaps a pit stop in the zone.
Unfortunately for London this was the level they hit at the very start of February, just when the US went into freefall, and since then this index has been trying to extract itself from the mire.
The issues recently have been getting out of the R3 ratio bandwidth, which may well be a case in point today at 7300.
Range: 6950 to 7300
Activity: Good
Type: On balance only just bullish
[affilinet_performance_ad size=468×60]
Regarding the March expiry 7300 is not so much of an issue.
However, the market is still in or around R2 at 7250, so today’s close is critical.
Worth noting however is the proximity of R3 and DR at 7200 and 7150 respectively, so if it can avoid any banana-skins from the US London is rather well underpinned this expiry.
Also, worth taking on board is the fact that the zone is lower here.
Range: 7200 to 7250 or 7250 to 7450
Activity: Moderate
Type: Bullish
[affilinet_performance_ad size=468×60]
Posted in Uncategorized
February 14th, 2018 by Richard

DJX Feb to Mch Rollover 14th Feb 2018
Monday was the big day for the DJX as R3 was still at 24300 (from our previous table on the 8th Feb) and the low was 24290.
This kept this index in the R1 ratio bandwidth and gave it a fighting chance for the expiry this Friday, much like the SPX and their battle with 2645, which we highlighted on Tuesday 13th Feb.
Considering the DJX hit B1 at 26600 on the 26th and 29th Jan (highs 26616 & 26608) and it has been all the way down to 23778 (6th Feb), or DR at 23800, which was B1 incidentally just days before, means it only now just has to reach 25000 for the perfect expiry.
But this is a very big “only now just” considering it has been on a 2800-point trip this expiry.
Range: 24300 to 25000
Activity: Very good
Type: Bearish
[affilinet_performance_ad size=468×60]
Becoming bit of a theme this but the March DJX big clue is here the zone is 24400-24600.
This actually means it is currently below the market, putting it back into bullish territory.
Still a lot of Y ratio around for a triple witching expiry, but the main issue here is really whether or not this snap back into reality will continue.
It’s not as if it doesn’t have enough room to play in, and as we saw with the DAX recently, a round trip finishing back at the zone covers far more ground and is better trading than just a straight line.
Range: 24600 to 25400
Activity: Average
Type: Neutral
[affilinet_performance_ad size=468×60]
Posted in Uncategorized
