Category: Uncategorized
April 16th, 2018 by Richard
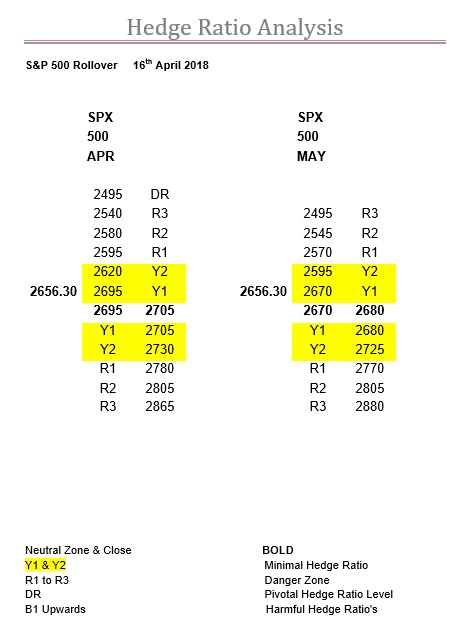
SPX Apr to May Rollover 16th Apr 2018
Rather coincidentally in the SPX our last comment was when it had closed at 2656.87 3-days ago, so a lot of huff and puff to travel -0.57.
The big change today is the return of the zone to 2695-2705, but we see this as being symptomatic of the amazingly low levels of ratio rather than directional.
As we said last time a 185-point wide Y ratio bandwidth is extreme, and unique.
And, as if the minimal Y ratio is not low enough the Y1 level is actually so low between 2645 and 2705 it might as well be the zone in its own right.
This really could be a rollover and expiry that sets records.
Range: 2620 to 2730
Activity: Moderate
Type: On balance definitely bearish
[affilinet_performance_ad size=468×60]
For the first look at the May expiry and it does come across as bit of a compromise, with the zone here dissecting the two levels we have seen in April.
However, again we feel that this is just symptomatic of the dire levels of ratio currently present.
The rollover from one intermediary to another is always going to be low in ratio, but even so this is exceptional, even with a week to go before it becomes the alpha expiry.
The Y ratio bandwidth here is 200-points, so not a huge difference, which just goes to underline the fact that with such little ratio we could easily see 2% to 3% or more daily moves.
Range: 2595 to 2725
Activity: Average
Type: Neutral
[affilinet_performance_ad size=468×60]
Posted in Uncategorized
April 13th, 2018 by Richard

FTSE & DAX Ratio Table 13th April 2018
Since we mentioned (Tue 11th April) in the FTSE “we would have expected a bit more of a fight at 7250” it has done nothing but.
So much so yesterday held this market in its narrowest range for ages, basically a few points either side of the upper boundary, which you may have noticed today is now R1.
Again, no disguising what it wants, just not quite the desire, and don’t forget R2 and R3 now come in quick succession if it does manage it.
However, the big issue now is the rollover and expiry next week, so it could be just a spike.
Range: 7150 to 7250 or 7250 to 7300
Activity: Moderate
Type: On balance definitely not bullish
[affilinet_performance_ad size=468×60]
We are happy to call yesterday’s high in the DAX of 12434 a test of Y2 at 12450 especially as it was at the end of a 152-point move up.
The real question is how aggressive they will be as so far all they have done is travel 650-points up through the minimal Y1 ratio over the last 5 trading days?
Again, with the rollover starting on Monday this index could expire anywhere as the zone could easily end up anywhere within that Y1 ratio bandwidth.
Basically, what a truly exceptional market as even after 4-weeks it still has a 1000-points of Y ratio, which is quite outstanding, but hold on tight nevertheless.
Range: 11850 to 12450 or 12450 to 12600
Activity: Very poor
Type: Bearish
[affilinet_performance_ad size=468×60]
Posted in Uncategorized
April 11th, 2018 by Richard

SPX , NDX & DJX Ratio Table 11th April 2018
In the SPX our last comment on the 5th April was “big moves are now only to be expected but please bear in mind the market is still below its zone, where the ratios continue to fall, and which in itself may see another drop, while they still rise above it, all of which is bearish, so it is by no means out of the woods yet. And beware of whipsaw in a colossal 100-point trading range”.
Full marks then.
Zone now 2645-2655, whipsaw, big moves and ratios still diverging.
At least the market is now above its new zone, but the real point is that we can’t remember a Y ratio bandwidth in this index at this stage of an expiry that stretches for a colossal 185-points, and with the rollover next week it is not going to get any quieter.
Range: 2595 to 2780
Activity Poor
Type: Neutral
[affilinet_performance_ad size=468×60]
It seems a very long time ago the NDX was testing Y2 at 6325, and not just the once as it needed confirmation with the low of 6322.60 on the 2nd April and then 6326.54 a couple of days later resulting in an eye-watering 233.52-point (3.69%) bounce.
However, in trading days that was just 4 days ago and already it has 300-points between then and now, which is tremendous going.
And we can’t fault them for trying as they have added another dozen strikes, and activity is at least present, but alas still no change in the ratios.
No need to mention the Y ratio bandwidth here as that has been the point all along this expiry and it was, is and no doubt will continue to do exactly as this situation dictates.
Range: 6325 to 6775
Activity: Moderate
Type: On balance only just bearish
[affilinet_performance_ad size=468×60]
In yet another of those coincidences the DJX managed to cling on to its zone by its fingertips, which is not too dissimilar to the SPX (1.87-points above their zone).
However, the zone here hasn’t changed but quite a few of the ratios have.
This is all the more remarkable due to the level of activity, but they have come in significantly at both ends.
One example is R3 below the zone that last Friday was 23800 (nb. Low 23738) but today is 24000.
This is worth noting as the previous low in this index was 23523 and it was DR at 23600 that stopped the plunge that time, and on both occasions this index was staring at a drop of almost 800-points.
Rather ironically it could be this index that has a calming influence on the SPX as here the Y ratio bandwidth only stretches for 800-points.
Range: 24200 to 25000
Activity: Very poor
Type: Bullish
[affilinet_performance_ad size=468×60]
Posted in Uncategorized
April 11th, 2018 by Richard

FTSE and DAX Ratio Table 11th April 2018
Just a few days ago the FTSE was struggling with 7050 but as perfectly normal once back inside its zone, which back then (Friday 6th) was 7100-7250, the next goal was always the upper boundary.
We would have expected a bit more of a fight at 7250 and with the auction adding 4-points means it closed 16-points above it, but the mining sector is bit of a goliath.
The fact it is just Y2 would have helped, but R2 at 7300 will be a far sterner test, one which is backed up by R3 just above it.
Of course, the downside was that titanic battle with DR, which he corresponding level here is still 7500, but with the rollover next week that might just prove a step too far.
Range: 7150 to 7250 or 7250 to 7300
Activity: Moderate
Type: On balance bullish
[affilinet_performance_ad size=468×60]
The only ratio to change in the DAX since we last looked is R1 below the zone comes in a little bit, otherwise it has all been about the Y1 ratio bandwidth.
It has taken a little bit longer than expected but the high yesterday was 12428, so very close now to a test of Y2.
When it was going the other way, it hit R1 at 11800 on 23rd March (low 11818) and although it did go lower by and much it has all been about this level culminating in the actual move of the zone there.
Of course, the corresponding R1 ratio level here is at 12550.
Range: 11850 to 12450 or 12450 to 12550
Activity: Good
Type: Neutral
[affilinet_performance_ad size=468×60]
Posted in Uncategorized
April 6th, 2018 by Richard

FTSE & DAX Ratio Table 6th April 2018
And so, with one mighty bound the FTSE leapt over 7050, and we must say it was definitely coming.
London’s madness of calling the open the previous close, i.e. 7034.01, is blatantly stupid as in the real world a conservative guess was up at least 80-points.
The significance of this is that would have made the open 7114, which was also above the bottom boundary of the zone.
The big news today is the zone, which is unusual for the FTSE, is now 150-points, but also there is no more Y ratio.
Hopefully, it will consolidate in its zone, but don’t forget whilst on the bear tack it was all about DR, first at 6950 then 6900, so still loads of potential scope and time.
Range: 7100 to 7250
Activity: Very poor
Type: Bullish
[affilinet_performance_ad size=468×60]
For the record the DAX opened up 196-points.
More importantly you couldn’t get a more fortuitous switch in the zone as on that Wednesday it dipped down to 11792, near enough the middle of the new zone, before recovering, and then yesterday taking total advantage of all that minimal Y1 ratio.
The ratios continue to strengthen above the zone, but for once they have also below it, so much so we actually see R2 appear.
The thing about there being such a huge amount of Y ratio is you will get big moves, but if you know this then you will be one step ahead and not get too caught up with the hyperbole.
Range: 11850 to 12450
Activity: Average
Type: On balance only just bullish
[affilinet_performance_ad size=468×60]
Posted in Uncategorized
April 5th, 2018 by Richard
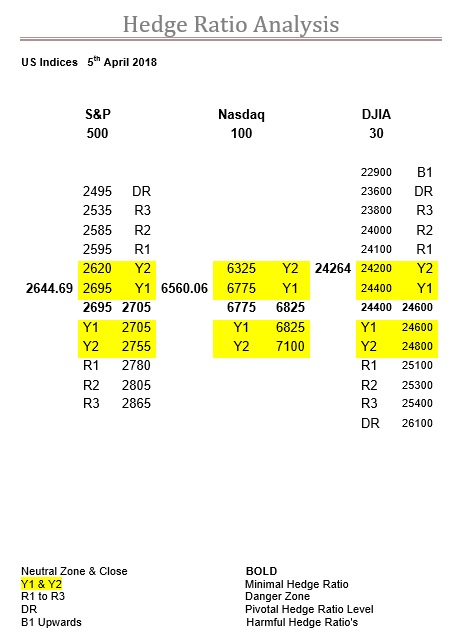
SPX , NDX & DJX Ratio Table 5th April 2018
It was a huge day on Tuesday in the SPX, the day of our last comment, and it was all about R2 at 2595 and R1 at 2600.
The market opened at 2592.17 so the battle was on from the very start, and it basically spent all day around these R levels, but most importantly of all it finished at 2614.45, above them.
In keeping the Y ratios now stretch all the way down to 2595, and as long as we remain below the zone we stand by our statement “but no mistake we are still in a bear market”.
However, as we also said, “on a more positive note if this index can get back into that ocean of Y ratio then just look at what the NDX is doing” so all in all exactly as expected.
Big moves are now only to be expected but please bear in mind the market is still below its zone, where the ratios continue to fall, and which in itself may see another drop, while they still rise above it, all of which is bearish, so it is by no means out of the woods yet. And beware of whipsaw in a colossal 100-point trading range.
Range: 2595 to 2695
Activity Moderate
Type: On balance only just bullish
[affilinet_performance_ad size=468×60]
That is strike 2 of Y2 at 6325 for the NDX as the low yesterday was 6326.54.
Nothing else has changed but we have to speculate whether the reaction would have been so strong had the DJX not also hit their DR at the open.
Activity is still ticking over and now we are half way through perhaps we may well start to see some R ratios appear, although Y2 seems to be doing a fine job for now.
Range: 6325 to 6775
Activity: Average
Type: Neutral
[affilinet_performance_ad size=468×60]
It seems DR at 23600 still remains a critical level in the DJX despite it being breached on the Monday.
The fact DR has been at 23600 since Tuesday 28th March also means it has had quite a degree of solidity.
However, please note that the zone here has dropped yet again, this time to 24400-24600, which in itself is not a good sign, but rather ironically it does make it closer and therefore easier to get back above.
In the meantime, activity has returned and this index now has a thousand-point Y ratio bandwidth, and with over two weeks to go boring we suspect it will not be.
Range: 24100 to 24400
Activity: Average
Type: Neutral
[affilinet_performance_ad size=468×60]
Posted in Uncategorized
April 4th, 2018 by Richard

FTSE & DAX Ratio Table 4th April 2018
What with the holiday it seems far longer in the FTSE than the 2 actual days since our last comment.
And more to the point all the changes in the ratios come above the zone.
So, as R2 at 7050 has been static, it gives a far clearer indication of just how important this level still is, as it formed a perfect head and shoulders pattern with 7050 being both shoulders, made all the more apparent as it was a sharp 40-point move up in both cases to establish them.
Basically, the FTSE has been knocking on this door for the last three days, so no doubt where it wants to go, so the only question is whether the others will let it.
Range: 6950 to 7050 or 7050 to 7100
Activity: Average
Type: Bullish
[affilinet_performance_ad size=468×60]
As we said in the DAX “but it is so one-sided one can see it is now on dangerous ground”.
It has been 2 days since our last table, but to produce a daily range of just 156-points after recent swings and moves, especially on the back of a huge move Stateside, makes us strongly suspect this move in the zone has just happened today.
Nevertheless, it is most certainly spectacular and must be a record, as we can’t ever remember it jumping 600-points, even during the QE excesses.
The fact is though it is on very decent activity, and the zone may have changed, but only really going from one end of the Y1 ratio bandwidth to the other, with all the other ratios by and large unchanged.
End result is it is now back in bullish territory, in a 700-point bandwidth, weeks to go and people are playing.
Range: 11750 to 12450
Activity: Strong
Type: Neutral
[affilinet_performance_ad size=468×60]
Posted in Uncategorized
April 3rd, 2018 by Richard

SPX NDX & DJX Ratio Table 3rd April 2018
A lot has changed since we last looked at the SPX (28th March) despite it being just 2 trading days.
However, as we said, “but no mistake we are still in a bear market” and it now looks even worse.
Firstly, we must point out that in our last ratio table R3 was at 2570 and today it is 2545, so in an obviously falling ratio market, yesterday would have put it at 2555, (average over the 3 days) so again it catches the bottom 2553.80, so it’s not all gloom and doom.
The real issue for us now is the rate of decline in the ratios below the zone, the time left (18 days), the fact now the Y ratios stretch down to 2600 the zone could easily fall again and it still desperately needs a friend.
On a more positive note if this index can get back into that ocean of Y ratio then just look at what the NDX is doing, where 3% to 4% daily moves are not uncommon.
Range: 2545 to 2595 or 2595 to 2695
Activity Moderate
Type: On balance just fractionally bullish
[affilinet_performance_ad size=468×60]
Our last comment on the NDX had Y2 below the zone at 6375, and as one can see today it is 6325, so on the same basis as the SPX that would have made it between 6325 and 6350 yesterday.
Of course, it goes in 25-point bands so with the low being 6322.60 you decide.
Although, back on the very first day of this expiry (19th March) it was 6325 and considering the market was then 7019.95 it is churlish to focus on a meagre 25-points in truth.
Otherwise no change in our views but again another wad of strikes has been added so there is interest, it is just still way off the pace.
Range: 6325 to 6775
Activity: Average
Type: On balance only just bullish
[affilinet_performance_ad size=468×60]
In our last comment on the DJX we said “so how this index now reacts at either end will be absolutely crucial, and we wouldn’t put it past this market to have a bandwidth test today. Therefore, we should also mention a significant “step-up” level at 23700, so to us this level to 24000 would also constitute a bandwidth test”.
Within the first few hours the high was 23997 and it then went down to 23728.
The rebound did take it to its high of 24092 but the fact it closed back inside its R3 ratio bandwidth meant the breakout was still on the next day, to which it duly obliged.
Monday was a difficult day as once back below 24000 the next support was DR (again) and the fact the low was 23344, way below this level, is certainly a sit-up and notice warning sign.
The redeeming factor is that it closed back above it, and that it hasn’t changed since last week, although activity is very low so no real surprise.
Range: 23600 to 23900
Activity: Poor
Type: Neutral
[affilinet_performance_ad size=468×60]
Posted in Uncategorized
March 29th, 2018 by Richard

FTSE & DAX Ratio Table 29th March 2018
Here we have yet another spooky coincidence in the FTSE as the close in our first comment this expiry was 7042.93, then in our second 7038.97 and in this 7044.74.
That first comment was all about how crucial 7050 was and the second about 6950.
And as one can see from the table above both are still very relevant as was 6850 as the low (so far?) this expiry on Monday was 6866.94.
The zone has slipped slightly today, which makes the expiry target just that little bit closer and therefore slightly easier to reach, but there is still that pesky R2 in the way.
However, judging by the fact the auction added 15.99-points to the real time close yesterday this does somewhat suggest they are gunning for it.
Range: 6950 to 7050 or 7050 to 7100
Activity: Very good
Type: On balance just fractionally bullish
[affilinet_performance_ad size=468×60]
In our last comment on the DAX we called it “sedate” and said “but if it does get excitable then don’t forget it is still in a 300-point wide Y1 ratio bandwidth, and that’s just below the zone as well, so it could easily start motoring”.
And that very day it sprang to life with a 222.73-point move and has not really done any less every day since.
Back then there was a 300-point Y1 ratio bandwidth, including Y2 it went to 550-points, and that was just below the zone, but now, as one can see above, this is a whopping 800-points.
Activity suggests bullishness, but it is so one-sided one can see it is now on dangerous ground, as what precious little ratio there was has actually decreased.
Range: 11750 to 12350
Activity: Average
Type: Bullish
[affilinet_performance_ad size=468×60]
Posted in Uncategorized
March 28th, 2018 by Richard

SPX , NDX & DJX Ratio Table 28th March 2018
Just as we said yesterday “so at the moment it is a bounce off high ratio levels but no mistake we are still in a bear market”, and ironically the low (2596.12) was also right on a level we were talking about, 2595.
However, we have decided to produce the ratios on two consecutive days just to highlight the issue we were mentioning, and 2595 is a perfect example.
As last Friday it was R3 and by Tuesday it had fallen to 2570, where it remains today.
However, 2595 having been R3 is still at the top end of the R2 spectrum, having just recently dipped below the R3 threshold, so is what we call a step-up.
The problem yesterday came when it fell through R1 at 2645 having bounced off it initially, and as one can see today it has slipped to 2635, and this was further compounded by little or no support from R2.
This places a lot on the shoulders of R3 if it has to go there again, as sometimes just the one test is needed, so we suspect the real clincher will be if the DJX hits ratio support at or around the same time.
Range: 2600 to 2635
Activity Average
Type: Neutral
[affilinet_performance_ad size=468×60]
Poor old NDX and we have to give it a ten for trying as the activity is there, although obviously flattered by the benchmark being so low, but nevertheless.
However, it does just go to highlight the problem here, as despite being so one-sided it still hasn’t made any difference below the zone at all.
So, keep those ice-skates on.
Range: 6375 to 6775
Activity: Strong
Type: On balance bearish
[affilinet_performance_ad size=468×60]
As we say above a lot may well depend on the DJX and this to us is further reinforced by the level of activity here.
As one can see it is right at the top of the scale and one-sided enough to be influential we suspect.
However, it has changed the ratio landscape significantly as one can see as yesterday, at about the same time the SPX was bouncing off 2645 here they were bouncing off R2 at 24000.
The fact it closed below and then the ratios have changed around it means that now this index finds itself in the R3 ratio bandwidth.
So how this index now reacts at either end will be absolutely crucial, and we wouldn’t put it past this market to have a bandwidth test today.
Therefore, we should also mention a significant “step-up” level at 23700, so to us this level to 24000 would also constitute a bandwidth test.
Range: 23600 to 24000
Activity: Outstanding
Type: On balance bearish
[affilinet_performance_ad size=468×60]
Posted in Uncategorized
