Nb. Our comment from the 07/28/21
The exciting start to this expiry, as having scrambled straight back into bullish territory like a scalded cat, it continued on its upward trajectory.
Which was really the least we would expect, having found being below its zone so distasteful.
The first real ratio test came last Friday 23rd August when the market hit Y2 for the first time.
And it did a very reasonable job of stemming what was a very strong tide at that time, as having been as low as 4233.13, by the time it hit 4405, this was a rally of 172-points, or 4.06%. The high was 4407.54 for almost 2 hours.
And in just 5 trading days, so that is some momentum behind it, so, hence, good job.
Obviously, the market then hit a new all-time-high, which is always difficult to compete against, that day, and again on Monday, but only managing to add just 10 more points to Friday’s level.
The drop yesterday was significant, but also because it ended below 4405.
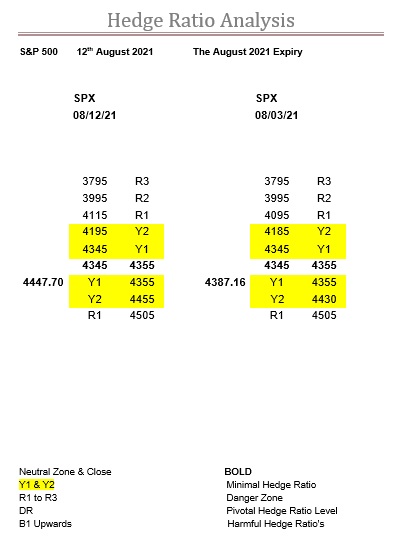
Interestingly, today is the first time that Y2 has fallen, and as you can see from the table above, it is now standing at 4415.
Overall, the picture remains much the same as the Y1 ratio bandwidth has increased slightly, but the overall Y ratio one has decreased.
Also, there is blatantly far more ratio below than above, revealing a fairly obvious path of least resistance.
Adding to all this is that the zone will move up to 4345-4355.
We could see the next four-weeks of this index knock knock knocking on the retreating Y2 ratio door, after all it wouldn’t be the first time. But, please do not lose sight on the fact that it continues to sit atop an abyss of ratio, and one which continues to not want to fill in behind the rising market, which is a real worry.
Range: 4305 to 4415
Activity: Moderate
Type: On balance bearish
Nb. Our comment for 08/03/21
The zone moved the very next day after we published last, so Thursday 29th.
In yet another apology from us, as we are seriously so underwhelmed by this, we hope it does not distract from these comments.
Of course, these days this is getting quite commonplace, but for far too long than we would like to remember, a zone move in the SPX was a really exciting event.
Nowadays, it is just as if by default, virtually natural geological erosion, albeit of the ratio variety other than natural features, rather than synthetic in nature.
Which essentially means the Y1 ratio bandwidth remains static at 245-points, as does the overall Y ratio bandwidth, at 410-points.
Remaining ridiculously wide, and therefore still very dangerous.
But, in the meantime, what we said last time is evidently what is still happening, as it knocked on the Y2 ratio door at 4415 last Wednesday, with the intraday high of 4415.47.
As you can see from the table above, Y2 is now 4430, and the intraday and, so far at least, expiry high, was 4429.97, the very next day. As we said, “knock knock knocking on the retreating Y2 ratio door”.
Activity has also seemingly dried up, but then again, as we are in the third week of a five-week expiry, then this is not really unusual.
As the SPX goes through the mid-expiry motions, it creeps higher leaving a vast void of practically no support beneath it.
So, on the surface it all looks good, even peaceful and serene, with rising ratios below the zone, which is in itself rising, as well as retreating ratios above it but, make no mistake, this is not a risk-free market, although most evidently think it is.
For us this risk is actually quantifiable, as the corresponding Y2 level is currently at 4185, which is 202-points away (4.6%), which should at the very least give you something to put into your models.
Range: 4355 to 4430
Activity: Poor
Type: On balance bullish