Nb. Our comment from the 07/19/21
We did get our perfect expiry in July, in ratio terms that is, so we are very pleased naturally. And, we were more than happy with the index staying inside its zone all day on the rollover (Wednesday), but just to add that bit of extra icing on the cake, the market spiked up on the actual expiry to make the EDSP 7058.71, which was just in the zone as well. Happy days.
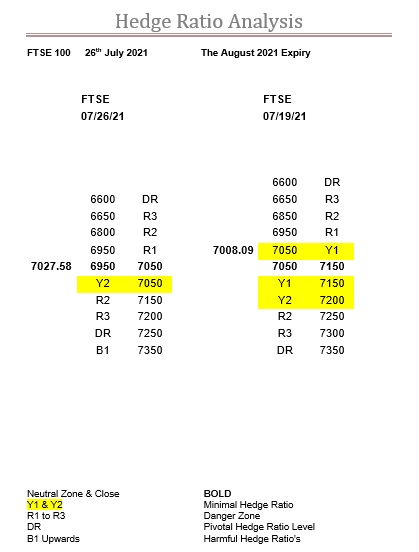
However, derivatives are a forward-looking game, so getting straight into the August expiry and you can see the zone is the same.
And, if you cast your mind back to the start of the July expiry, the market went down to test R1 at 6950 with the intraday low of 6948.63 on the 21st June before recovering to end the day in its zone.
We are not saying that this is going to happen, but that is exactly where R1 is at the start of the August expiry, and in another twist of fate, the market opened that day at 7017.47, where the open today will be 7008.09. Hmmmmm.
The good news, for the bulls at least, is that above the zone R1 does not kick in until 7250, and then it’s not R1 but R2.
This is a huge jump up in the dynamic delta from the Y ratios, so that will be like running into a brick wall should the market get there.
Should be a lot more fun this expiry, as there was no doubt about it that the FTSE was getting extremely frustrated being corralled within its zone for pretty much the entire four weeks of the last expiry.
So, if it only continues on with the level of sensitivity it had in the July expiry, then we have a potential trading range over the 5-weeks in the August expiry of 6950 all the way up to 7250, a probably very welcome 300-points. Enjoy.
Range: 6950 to 7050
Activity: Very good
Type: Neutral
Nb. Our comment on 07/26/21
The FTSE certainly got its “freedom” but perhaps not in the way many expected.
Ourselves included, as we reckoned on a drop down to test R1, then at 6950, was most likely, followed by a bounce just like the July expiry.
Sadly, we didn’t anticipate a very bad opening last Monday, which by our reckoning was circa 6944 (the official 7008.09 is rubbish) which meant it was below our level before the dynamic delta even had a chance to kick in.
Bit like going limit-down in commodities.
Furthermore, holding our hand up, the incursion past R2, then at 6850, was far deeper than we would have liked, but in our defence, we are unsure when it changed.
By which we mean, and as you can see in the table above, that today R2 is at 6800, but when we checked at the end of last week, it was actually at 6750.
And the significant changes in the ratio table above can only be caused by a significant amount of activity.
Of course, it doesn’t take much to change the Y ratios, as that is what they are designed for, but shifting R2 around like a chess piece, takes quite a lot.
And, whilst on the subject of R2, please note that above the now changed zone it is at 7150, albeit only just.
Also, worth noting, is that every 50-points after this the exponential ratios climb steeply.
Final point of note, is that last Thursday the intraday low was 6956.24, which was either R1 or R1 and the bottom boundary of the zone, depending on when it changed.
Whichever it was, as it stands now, the market is back inside its zone, and it knows what is beneath it now, so all that remains is to find out how aggressive it might be should it test the upper boundary. And, please do keep an eye out on where the SPX is in relation to its ratios.
Range: 6950 to 7050
Activity: Very good
Type: On balance bearish