Category: Uncategorized
August 15th, 2018 by Richard

DJX Aug to Sept Ratio Rollover Table 15th August 2018
We would like to say the DJX tried in the August expiry, and it did, to an extent, just not very hard.
By this we mean it had a 1000-point zone to play around in, and did it take advantage, well quite frankly, no.
In July we saw this index make an 8% round trip, yes, that is correct 8%, by bouncing between respective levels, like the FTSE has done this expiry.
In August they got fixated by the upper boundary, so at the start it was 25058 and now it is 25299, having been as high as 25692, so one would be lucky to squeeze 4% out of that.
This is because in the second week they had three consecutive highs of 25500, 25490 and 25488 and each time failed to breach their zones upper boundary at 25500.
So, by the time they had regrouped and tried again a week later, this time successfully, the SPX was hitting their R1, which messed up their advance here.
Tunnel vision really as the opportunity to go all the way back to 24500 and then go for the second assault with loads of momentum is essentially a missed chance.
Furthermore, in a bizarre twist right at the end they appear to have got interested, although the activity suggests the exact opposite, by introducing 24 new strikes. Not just bizarre, actually plain weird.
Range: 24500 to 25500
Activity: Moderate
Type: Bearish

Perhaps all that late interest in August is shining a light on Sept and we will see a bit more interest here in the next few days.
We said at this point last expiry (so looking ahead into August) “Perhaps a 1000-point zone is the new norm?”, and the first aspect that strikes us in Sept is the zone is back to normal.
Only time will tell if this will be a good or a bad thing, as in the 2 expiries we have just had with this situation, we saw July take full advantage, but August, as we say above, got consumed with 25500.
Overall activity is way ahead already, but we have to point out that August’s was exceptionally low and Sept is a triple, so it should be far greater anyway.
As a slight rule of thumb that although it is significantly more active we are not really impressed, and if anything, it is slightly disappointing for the penultimate biggie.
If the DJX can break its zone dependence, and having a normal 200-point one is the way to do it, then the Y2 ratio levels are a considerable distance apart, so we suspect it will be more like July than August. Well, here’s hoping anyway.
Range: 25100 to 26100
Activity: Average
Type: Neutral
Posted in Uncategorized
August 14th, 2018 by Richard
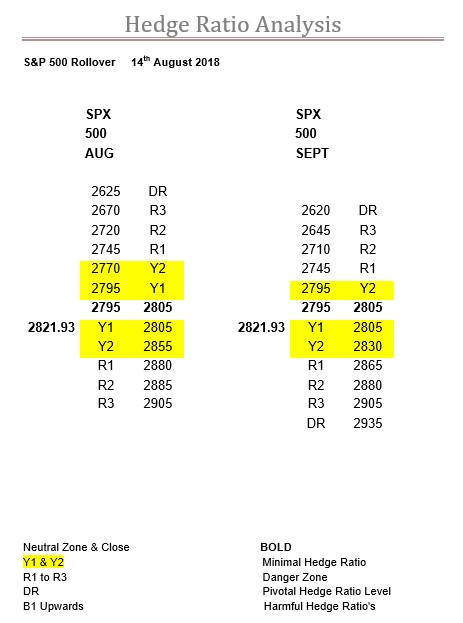
SPX Aug to Sept Ratio Rollover Table 14th Aug 2018
It has been a very controlled expiry so far for the SPX, all that remains to be seen is if it can maintain this for the next few days, or at least until tomorrow.
From the very start of this expiry on the 23rd July this index set its stall out with the low of 2795.14 and the high of 2808.62, or to be more precise a zone bandwidth test.
It then went on to test R1, which was then at 2850, with the high of 2848.03, that same week before settling down and returning to its zone by the start of the second week.
Of course, for them to have a perfect expiry we would have needed to see a test of 2720, but at the end of the day it couldn’t break down and below its zone.
This was in large part due to the DJX, which was at that point in time battering on their zones upper boundary, 25500, which made it hard for this index to go in the opposite direction.
However, the SPX did return the favour, as when the Dow eventually got above its upper zone boundary, here they were running into R1 again, which by this time had slipped to 2860/2865, and this time it was the DJX’s turn to fight against the tide.
Currently, the SPX is in a good spot, no real pressure, as with their Y1 ratio bandwidth now stretching up to 2855 anywhere here or hereabouts would not be too bad.
In fact, the zone could easily flip to 2820-2830, or higher, so that gives it plenty of tolerance for a successful expiry.
The only issue may be that under these circumstances it can sometimes get a bit blasé or overconfident, so can find itself getting ambushed if one of the others, probably the DJX, has an agenda.
Range: 2805 to 2880
Activity: Average
Type: Bearish
We always like to think that when the big expiries come around the SPX should stand up and take over, making sure everyone knows its time for the big boys to play.
Weirdly, however, this never seems to happen, and despite the enormous increase in activity making it easily the biggest player in town, it can still get bullied and pushed around.
There is still three days to go, and we are rolling over into a five-week expiry, which means the first “extra” week can be a slow starter, so a lot can and probably will change, but it is nice to see so much Y ratio present in a triple witching expiry.
Nevertheless, there are a couple of pointers we can ascertain this early, and the main one is that the mighty Sept would not get in the way should August’s zone change to 2820-2830.
However, anything above that may cause issues.
Secondly, that the R ratios start at 2865 above the zone and then build all the way to R3 quite quickly, or within 40-points at least.
Normally, we would expect the ratios to build (come in towards the zone) either side at this stage, so if anything, this should narrow.
Interestingly, this is not the case below the zone, and you have to get down to 2645 before one encounters R3, which is almost 200-points from where the market is now, to put (no pun intended) it into perspective.
Therefore, it is worth mentioning the Delta Ratio we calculate is already standing at 67.9%, so while this is not at an extreme it is indicative of there already being a significant put bias, which considering how the ratio cards have fallen, is contradictory.
No matter how the ratios develop, as things stand, there is still 120-points between the R1 ratios, so a more than a decent enough trading range, and on top of this it would be a very rare triple that was contained inside just R1, so should be fun.
Range: 2805 to 2855
Activity: Average
Type: Neutral
Posted in Uncategorized
August 14th, 2018 by Richard

FTSE Aug to Sept 2018 Ratio Rollover Table
All very exciting for the FTSE and it is still looking good for that perfect expiry.
Our last comment was “however, calling the zone is going to be the tricky part” and as one can see from the table above it has already made its move.
This gives it a lot of tolerance for this week however we don’t think it is a given that the zone will move to 7650-7750, as we suspect what we are seeing is the follow through momentum that was so blatantly last time, but since then the market has reversed.
Don’t forget it has been as high as R2 (now R1) at 7800, getting as high as 7790.17, so in essence as the ratios have been reflecting this the market has turned and passed them going the other way.
And, in fact, now the ratios are actually weaker below the zone.
Also, yesterday the low was 7614.48, very close to if indeed it wasn’t, a test of the bottom boundary of the zone.
So, we could easily see the last two trading days reflected in the zone staying put at 7600-7700 now the steam has been taken out of it.
It is perhaps worth contemplating that the close on the Friday of the last expiry was 7678.79, so on paper this market has gone nowhere, but for us from here it went up to R1 at 7750 (high 7751.10) then down to the corresponding R1 at 7550 (low 7549.34), before recovering back up to test R1 again, before hopefully eventually ending in its zone.
So, if you are aware of the ratios at these levels and what the possible outcome may be, for a market that has gone nowhere, there has been 200-points to have been had between the two R1 ratios, and then another 200-point recovery to make an impressive 5.16% on offer, and in just 4-weeks.
Fingers crossed for us as it would be great to see a perfect expiry here in the FTSE.
Range: 7600 to 7750
Activity: Poor
Type: Neutral
Sometimes it is worth reminding ourselves of what we said at about this stage for what was then the upcoming August expiry; “At the end of the June expiry our comment was…. so, the question is whether or not it is safe to get back into the water in July? Sadly, the answer is no…. but looking forward to August and the answer is a resounding yes”.
And August looks very likely to be rewarding us with a perfect expiry.
Looking ahead to Sept and the water is still safe, or as safe as any triple witching expiry can ever be.
Furthermore, it looks like being a fairly straightforward affair, assuming the ratios remain fairly static.
The really big issue is the zone, which is down at 7450-7550, which means August’s best bet is to aim for Wednesday and then just take the foot off for the last two “grey area” days.
However, when it gets going, below the zone the ratios jump from Y2 to DR at 7350, so that is a good, solid support level.
On the other side the jump from Y2 to R2 at 7750 will cause problems, but it is a triple, so a lot will depend on what the other markets are doing at the exact moment this index hits this level.
Behind that there is DR at 7850, which again is a far more solid level.
Overall it is also worth remembering that if it really does get animated, which we haven’t seen really so far this year, then triples can be B1 to B1 affairs.
Regardless, the potential for this expiry in the FTSE is 7350 to 7750/7850, which is a big range for this index.
Range: 7550 to 7750
Activity: Average
Type: Neutral
Posted in Uncategorized
August 10th, 2018 by Richard

FTSE & DAX Ratio Table 10th August 2018
As we have already seen the FTSE go from R1 above the zone to R1 below the zone (7751.10 to 7549.34) all we need now for a perfect expiry is for it to finish in its zone.
In fact, the recovery all the way back up to re-test R1 above the zone is totally normal and as we said earlier, actually expected.
However, calling the zone is going to be the tricky part because as one can see from the above table the ratios are storming ahead below the zone, so much so there is no Y ratio left at all.
In fact, mostly the levels have stayed the same just the ratio level has gone up a level.
To add another bullish signal the ratios above the zone are in (almost) full retreat, which does raise the question as to why this market had so much trouble with 7750.
It was obviously still R1 on Tuesday as the market camped out on it for a full hour before capitulating and giving up 35-points.
Then on Thursday it gave way, but only after the fourth test, however what was more revealing was that several hours later the market came back for a kiss before ending well above it.
This is the last day before the rollover, which is into the Sept triple, which is also a 5-weeker, so it should get very exciting, and we can’t wait to see where Sept’s zone is.
Range: 7700 to 7800
Activity: Moderate
Type: Bearish
There is no disguising the fact that the DAX is as dull as dishwater at the moment.
We did have a bit of excitement on the Tuesday after our last comment with a range of 177-points, but in the end, it finished just down 17-points.
This is perhaps all the more disappointing for two reasons, the first being that it is in the middle of a 300-point Y ratio bandwidth, so it should be whipsawing around.
Of course, we saw the previous week it tried so hard over several days but failed to breach 12850, and the trouble is it now knows what is there and is evidently too scared to go back.
Which covers the second reason, as having copied the DJX for so long when they eventually breached their resistance level, 25500, the DAX did not take advantage.
Again, still hardly any changes in the ratios, so whether or not it wakes up for its rollover remains to be seen.
However, we suspect it will react to others, especially having so much tolerance currently built in, rather than take the lead itself.
Don’t forget the new expiry here is always slow to start, on top of which it is a 5-week one, so we don’t think that Sept will unduly influence the rollover here.
Range: 12550 to 12850
Activity: Moderate
Type: On balance just bearish
Posted in Uncategorized
August 9th, 2018 by Richard

SPX , NDX & DJX Ratio Table 9th August 2018
Judging by the activity the bulls are back in town in the SPX, as for once this expiry the type is tipped in their favour, albeit only just.
The ratios are a mixed bag as well, to explain, we have decent strength below the zone but at the extremity DR actually slips.
Above the zone it is the reverse, as they all slip apart from R3, which gains 30-points.
So, rising below and falling above is bullish, but the real problem here is that they keep banging their heads on R1, and don’t seem to have enough will or firepower to break above it.
On Tuesday R1 was at 2855, today 2865, so presumably yesterday was 2860, and the high of 2862.44 bears this out.
Points to consider are that there is still over 100-points of Y ratio bandwidth below this market and the rollover starts next week, which also leads into the third big expiry of the year.
On a more positive note, and in the absence of any great motivation, there is now plenty of Y1 above the zone that could easily see the zone compromise for the expiry by moving itself.
Range: 2805 to 2865 or 2865 to 2880
Activity Average
Type: On balance just fractionally bullish
The NDX is a very difficult read, although that is now not last Tuesday when we said “here it doesn’t have to decide until 7475”.
Needless to say, the high on that day was 7478.96, and the rebound took the market down a rather impressive 35-points.
Wednesday was pretty much a repeat with the high being 7486.21, which was a double peak, so not only did it make a slightly deeper penetration it came back for seconds.
The pullback was an even more impressive 50-points, but the most important aspect was the close, significantly poised just below Y2.
This, of course, brings around the distinct possibility of them employing the opening gap gambit, to effectively leapfrog this level.
However, this would be strike 3 so we actually have no axe to grind anyway.
The issue to us, and what makes it a difficult read, is the activity, which is all mainly put related.
The problem is it is not enough to qualify as a big player, so it is difficult to tell whether it is actually bullish or bearish, sorry, but the market movement suggests bullish.
Range: 7375 to 7475 or 7475 to 7625
Activity: Strong
Type: On balance definitely bearish
To be fair breaking through its zones upper boundary is not as hard as taking on R1 like the SPX, and anyway it had been trying for over two weeks so it wasn’t before time.
The big difference here is that there is no more Y2 above the zone, just a stupidly huge Y1 ratio bandwidth.
Also, below it there is still that 1000-point zone of no ratio at all.
At the moment it is all calm and peaceful, but with the rollover, expiry and the mighty Sept trip on the horizon, then just like the arid landscape, all it would take is one little spark and 300-point moves in either direction, or even both on the same day, are more than likely.
Range: 24500 to 25500 or 25500 to 26500
Activity: Moderate
Type: Bearish
Posted in Uncategorized
August 7th, 2018 by Richard

SPX , NDX & DJX Ratio Table 7th August 2018
Of course, it is no coincidence to us that the SPX closed at 2850.40, which was exactly where R1 was.
So, the big news today is that it is now at 2855, although in reality this doesn’t actually change much, if anything.
The long and the short of it is that the SPX is challenging, or absorbing, the futures selling created by dynamic delta hedging to the tune of R1, which means there are bulls out there, so the only question that remains is are they bullish enough to buy them all?
The fact the market closed right on the line means it is 50:50 at the moment, and please bear in mind where the DJX closed, so today is a really big decisive day, will the bulls be bold enough or will it slip back into the safety of its Y ratio bandwidth?
Range: 2805 to 2855 or 2855 to 2875
Activity Moderate
Type: On balance bearish
No coincidences in the NDX, but being left to its own devices it is certainly making full use of its Y1 ratio bandwidth.
Don’t forget this expiry it has already be down to 7150, and here it is, just a week later mind, staring down the other end of this bandwidth.
A rather cool 300-points, 4.2%, in just seven days.
The only change here is its zone which has moved up a bit, but all within the Y1 ratio bandwidth, so not very compelling, especially as neither of the Y2 levels have changed.
So, in itself the move up is bullish, but without the corresponding firming of the ratios below and weakening of them above it does tend to look more administrative than directional, even more so when one considers the level of activity.
However, even being ignored is not going to affect it, probably in fact encourage it, so unlike the other two here it doesn’t have to decide until 7475.
Range: 7375 to 7475
Activity: Poor
Type: On balance bullish
Exactly the same as the SPX here in the DJX so therefore, of course, it is no coincidence to us that the DJX closed at 25502, which is exactly where the upper boundary of their zone is.
The difference between the two is that firstly the boundary hasn’t shifted like R1 in the SPX, but probably more importantly is that last week the DJX attacked this level on three consecutive days, so yesterday makes strike 4.
Therefore, the bulls are evidently far more active here, but after that it remains the same, as they still have to buy those futures shaken out by the dynamic delta at the top of their zone.
Although, after four attacks one does have to wonder how much can possibly be left to cause a problem?
Range: 24500 to 25500 or 25500 to 26000
Activity: Moderate
Type: Not bearish
Posted in Uncategorized
August 6th, 2018 by Richard

FTSE & DAX Ratio Table 6th August 2018
That has to be a new record for the FTSE as on Wednesday 1st August the high was 7751.10 which was a test of the ever present R1 at 7750.
Then on Thursday 2nd August the low was 7549.34 which was a test of R1 below the zone.
For the FTSE a 200-point move in 24 hours is extreme and coincided with a half point hike in the rates.
We of course don’t know what news will come when, or how the market will react to it, but all we can do is point out where dynamic delta (futures buying and selling) will occur and to give you an idea of the amount of futures involved.
Obviously, one can draw their own conclusions, but for us this does show how thin it is out there, primarily due to how the market reacted almost instantaneously to what is in effect a relatively small amount (R1) of futures activity.
However, and this is more speculative, how and what derivative activity there has been, and the resultant change in the ratios, can reveal what may happen next.
The fact that the ratios have risen below the zone and fallen above it are two bullish signs, and the fact it has been outside either side of its zone, means that this should be no impediment from now on, and with the half way point passed we can see another (and very probably successful) assault on 7550 next week.
Range: 7600 to 7700
Activity: Moderate
Type: Bearish
For the DAX there have been small tweaks in their ratios, but essentially, they are unchanged.
Of course, here last week was all about R1 at 12850, and they were very stubborn over it, unlike London, testing it on three consecutive days.
On Monday the high was 12848, then 12860 on Tuesday before finally 12833 on Wednesday.
Rather coincidentally these were the exact same days that the DJX was testing its zones upper boundary with consecutive highs of 25500, 25490 and 25488 respectively.
When the party was over it was a rather spectacular fall of 190-points, but at its worst it was off 244-points, and perhaps more revealing was that this was right to the middle of its zone, with the close right on the upper boundary at 12546.
This tells us the bulls are aggressive, just not committed, or have shallow pockets, but should this situation change and it went on like London to test its corresponding R1 ratio, then don’t forget this doesn’t appear until 12150.
Otherwise, the DAX looks like it’s mirroring the DJX, so it is probably worth seeing how it will cope with its zones upper boundary at the fourth time of asking having closed Friday tantalisingly just below it.
Range: 12550 to 12850
Activity: Moderate
Type: Bearish
As an aside, and we do sometimes feel obliged to weigh in on current issues, we looked on in amusement with the headlines of what makes Apple a trillion-dollar company.
Well the answer to that is quite obvious; it doesn’t pay any taxes.
This was just rubber-stamped by Amazon revealing the pathetic amount it pays.
Of course, one can’t talk about US companies without mentioning the Trump word, and it has obviously escaped his attention that this direct subsidy is just that.
Subsidy or tariff, tomAto or tomato, same thing.
The solution is very simple.
Rather than respond to Trump’s trade war trumpeting just impose a direct 20% sales tax on US companies instead of corporation tax.
However, with this sales tax there will be issued a tax credit note that will allow all US companies to offset the amount of sales tax they pay over here against their domestic corporation tax liability, in line with current international tax agreements.
Then suddenly his generosity in reducing US company’s corporation tax level to this current level may not look so clever if these tax credits result in a zero-tax liability Stateside for the Apple, Amazon, IBM and Microsoft’s of this world.
Posted in Uncategorized
August 3rd, 2018 by Richard

SPX , NDX & DJX Ratio Table 3rd August 2018
The SPX has finished the leap we caught mid-air in our last comment as the zone has now landed at 2795-2805.
All that remains to be seen is if this is just a very drawn out reaction to where it should have been since the last expiry, and if so, it is a move that hardly inspires confidence it is so begrudging, or something that may continue.
And to be honest it does look like a “if I must” kind of reaction, as the ratios below the zone, although better in places, have hardly taken advantage, and furthermore those above the zone are static.
We have seen a test of R1 here with the high of 2848.03 last week, and yesterday’s capitulation at Y2, high 2829.91, is the opposite of aggressive, so unless one or both of the other two have an axe to grind all we can see at present is this index whipsawing around in the Y ratio bandwidth.
Range: 2805 to 2850
Activity Moderate
Type: On balance only just bearish
The NDX last Friday went below its zone but managed to claw itself back into it by the close, finishing at 7296.76.
Then came Monday, and it having already broken down below the zones bottom boundary it was hardly going to be as steadfast as July’s, and once into the Y1 ratio there was literally no support.
So, on the Tuesday, when it rallied it was a big moment with the high of 7272.96, as it failed to break back into its zone.
This made Wednesday absolutely critical, for the bulls at least, and they failed to do it on the gap up at the open, only getting as high as 7269.20, and the close was 7272.89, so it was trying, but no doubt about it the bulls were having to fight tremendously hard just to keep near their zone.
Thursday saw the bulls backing themselves, but as we have pointed out above, they are in a bigger fight then they perhaps realise.
So, all to play for here, and lots of minimal Y1 to do it in, so basically more of the same until this bandwidth starts to narrow, if it does.
Range: 7325 to 7475
Activity: Very good
Type: Bearish
From a ratio stance the DJX certainly doesn’t have an axe to grind (see SPX comment) and if anything, they have already gone on holiday.
The ratios have changed below the zone, which will remain to be seen how significant this may be, but we now have a lot more Y ratio and the total loss of R3.
Currently what seems to be the problem is the top of the zone and their complete inability to break out through it.
The first three days of this week saw highs of 25500, 25490 and 25488, but it was not just this as none of the other two at these points were hitting meaningful ratio resistance so this roadblock is entirely their own.
Interestingly, there didn’t even seem to be any enthusiasm for leap-frogging opening gambits.
If anything, activity is symptomatic of money coming off the table, which is generally not a bullish sign when we are only half way through the expiry.
Range: 24500 to 25500
Activity: Average
Type: Bullish
Posted in Uncategorized
August 1st, 2018 by Richard

FTSE and DAX Ratio Table 1st August 2018
It is just staggering that it has been 12 trading days since we covered the FTSE so a lot has obviously changed since the 16th July.
And more about that soon but first the one constant has been 7750, this has been R1 throughout, and as one can see from the price action it was as potent yesterday as it was on the 24th July.
Back then this index got as high as 7740.64, which is close enough, but even more so as it was at the end of an 85-point rally, and then reinforced by the fact it has taken until yesterday to retest it.
Back to the changes and the most important is the rise in the zone, which has been backed up by the rise in the ratios underneath it.
The fact this index hasn’t yet tested its zones bottom boundary and Monday’s low was 7700.85, the upper boundary, tells us that the bulls are on top, just not yet confident enough to really attack even R1, and we thought this would in the end mean resorting to cheating, or using the auction in other words, as it was stuck around 7750 for so long.
Ironically it did manage to break up through it on the back of Wall St. and it was the auction that took it back down to it.
Nevertheless, once you know that 7750 is R1, which generates futures selling, then this sort of tussle makes perfect sense.
Range: 7650 to 7750 or 7750 to 7800
Activity: Moderate
Type: On balance bearish
It has been the same for the DAX, it being just over two weeks ago since we last published.
Therefore, it should be no surprise that there have been a lot of changes here too, but the only one that is similar is the jump in the zone.
Unfortunately, unlike a static R1 in the FTSE, here in the DAX, on our last view, we saw this index’s ratios jump from Y2 straight up to R2 at 12800.
Looking at the table above now then we see R1 starts at 12850 and R2 at 12950, so there has been a considerable falling off, we just don’t know exactly when of course.
However, the high on Friday was 12886, Monday 12848 and of course we can’t ignore yesterdays which was 12860, which suggests it had been by Friday at least.
The ratios below the zone here have also risen, but nowhere near so dramatically, and despite these two bullish signs activity is neutral.
The real issue is that despite this strength below and weakness above in the ratios, what hasn’t changed is that overall there is still far more depth of ratio above the zone than below it, which means the downside risk is far greater.
It is also worth noting that this index, like London, is already challenging the R ratios, and here the corresponding ones don’t appear until 12150, which is a long way away.
Range: 12550 to 12850 or 12850 to 12950
Activity: Good
Type: Neutral
Posted in Uncategorized
July 30th, 2018 by Richard

SPX , NDX & DJX Ratio Table 30th July 2018
Our last comment was whether or not they would make the zone 2795-2805 for July’s SPX expiry, and as the settlement price was 2802.41 we have to assume they did.
This also explains why August’s zone is a massive 35-points, as basically it too is trying to jump to 2795-2805, and you see it caught in mid leap as it were.
Surprising, as activity suggests it should have been more decisive, but overall it is underdeveloped for an expiry a week old, intermediary or not.
The real question is whether the high of 2848.03 on Wednesday, a test of R1, is going to be the defining moment of this expiry.
Range: 2805 to 2850
Activity Good
Type: On balance bearish
We did say that this index really needs to be monitored daily in the final stages of an expiry, such is the rate of change of everything.
The fact that when we come back to find August’s zone in the NDX at 7275-7325 gives us a fairly good estimation where July’s ended up.
Activity has been good, and when we compare it to the others then it certainly is at the top.
However, no sign of the big players, but we have noticed a lot of new strikes, so there is definitely the very strong possibility they haven’t gone far.
Nowhere near as dramatic as last expiry, but already we have seen a test of the zones bottom boundary, so not altogether dissimilar.
Range: 7275 to 7325
Activity: Very good
Type: On balance only just bearish
After such an impressive round trip in the July DJX we were pleasantly surprised to see the settlement at 24982, which was just in its zone.
Perhaps it doesn’t sound much but when one considers the SPX was targeting a 2800 finish then in light of that pressure this was impressive.
Also, this is true of the high that week, being 25215, and a big hit on R2 which was then at 25200 in July.
Looking at August and perhaps this 1000-point zone will be the norm now? Who knows, but it is the case so far in this expiry.
Basically, the ratios below this phenomenally wide zone have increased whereas above they are static.
At the moment in the DJX it is all about whether it wants to break out of its zone as the last two trading days last week saw strong tests of the upper boundary.
So, make note it is on strike 3 if it gets back up there.
Range: 24500 to 25500
Activity: Good
Type: On balance decidedly bearish
Posted in Uncategorized
