Category: Uncategorized
September 11th, 2018 by Richard

SPX , NDX & DJX Ratio Table 11th September 2018
It has certainly been a while since we last commented on the SPX, back on the 30th August no less, and in truth this index has been very disappointing.
We loved the aggression it was showing back at the end of August, taking on and making serious inroads into R2, and totally befitting a triple witching expiry.
Exactly what level of dynamic delta that causes any index to question its direction is always different, but just from the way it was struggling made it apparent that it was uncomfortable having to absorb all those futures.
But, at the end of the day, that’s what it is all about, so no complaints from us in this respect.
Where it gets very disappointing is that it has just stalled, and we can appreciate it, as it has happened so many times before, as the market doesn’t retrench very far because it expects to be met by a rising zone.
Of course, as you can see from the above table, the zone is static, which has confused the poor old market.
This means there is a risk of it remaining where it is, and therefore a bearish millstone for the market to wear around its neck.
However, one little twitch might be all it needs, and a very serious point is that it is the rollover next week, so calm before the storm and all that, and if it does get as excitable as the European markets then 2845-2855 for the zone is very likely, as is 2895-2905 now, which would be a massive game-changer.
No disguising the risk, the Y ratio bandwidth now stretches for over 100-points above the current zone alone, but also it wouldn’t take much to see this index get back to mixing it with the high R ratios.
Range: 2805 to 2905
Activity Poor
Type: On balance only just bearish

The NDX is certainly in a funny mood, and its aggressiveness has seemed to dissipate, and it has done exactly what we would expect, as when the emotion subsides the dynamic delta remains.
Of course, you can see a dramatic change in the ratios, but if not then eventually taking on R2 every step of the way, which is what it was doing, will eventually take its toll.
No denying, it has certainly made for an exciting market, and it is perhaps worth remembering that it closed on the first day of this expiry at 7371.42, down 6.13-points, and so far, it has been as high as 7691.10.
In respect of the ratios 7625 or 7650 seem to be the common R2 denominator, so it has taken on and beaten that, so it’s pretty much open season from here on in and fundamentals are still proving to be very influential still, so it is bit of a party out there at the moment.
They continue to still add strikes, so derivatives are still in the mix, but activity suggests they may not be the dominant force at present.
Range: 7325 to 7525
Activity: Moderate
Type: On balance bearish
Basically, we could copy and paste everything we have said for the SPX and apply it to the DJX here, of course the numbers would be different though.
The other main difference is that the ratios here have also changed below the zone, with Y2 being replaced by R1.
Also, we do calculate the ratios but do not publish them every time, so Y2 above the zone moving to 26600 is also a change since we last published.
Nevertheless, here it was all about Y2 at 26100 when we last commented, and this index as well had/has the potential to drop back to its current zone, but hasn’t.
Partially, we suspect, is because it expects it to move up to 25900-26100.
In fact, it could also widen, so 25800-26100 is a distinct possibility.
All very knife-edge stuff as with a static zone the risk over the rollover is big, but just another small twitch and the bulls could easily take charge again, so all in all we don’t believe it will be a quiet and calm rollover, hopefully at least.
Range: 25100 to 26600
Activity: Moderate
Type: On balance only just bullish
Posted in Uncategorized
September 10th, 2018 by Richard

FTSE & DAX Ratio Table 10th Sept 2018
It has been some considerable time since we last commented on the FTSE, but rather than reference the 29th August we would like to take you all the way back to what we said on the 14th August, almost an entire month ago.
A couple of little bits of housekeeping first in that although the above table looks unchanged from the 29th it has actually evolved and then returned to its original state.
Also, the market, in this expiry, never got much past 7600 as this ratio had turned to R1, which it found difficult to cope with and was mentioned at that time.
Furthermore, although we stated 7350, and the market did bounce very well off it on the 5th September, there is a considerable step-up in the ratios at 7250, which is where most of yesterday’s action took place.
Anyway, here are our comments from a month ago, and be honest, how improbable then did you think our range was?
“The really big issue is the zone, which is down at 7450-7550, which means August’s best bet is to aim for Wednesday and then just take the foot off for the last two “grey area” days.
However, when it gets going, below the zone the ratios jump from Y2 to DR at 7350, so that is a good, solid support level.
On the other side the jump from Y2 to R2 at 7750 will cause problems, but it is a triple, so a lot will depend on what the other markets are doing at the exact moment this index hits this level.
Behind that there is DR at 7850, which again is a far more solid level.
Overall it is also worth remembering that if it really does get animated, which we haven’t seen really so far this year, then triples can be B1 to B1 affairs.
Regardless, the potential for this expiry in the FTSE is 7350 to 7750/7850, which is a big range for this index”.
Range: 7100 / (7250) to 7350
Activity: Very poor
Type: Bullish
Here is a little reminder of our last comment in the DAX; “well, in truth, the surprise was only for those who were unaware of how the ratios were aligned for this expiry….Our minor disappointment was we never saw a test of 11950, which has today changed from DR to R3, as that would have been really spectacular….However, it seems R2 at 12150 proved admirably up to the task, with the last three lows of last week coming in at 12120, 12168 and 12135 respectively”.
And we certainly got our 400-point bounce all the way back up to its zone, where it bounced around for all of the second week.
However, the writing was already on the wall as we had seen 11950 drop from DR to R3, and as you can see from the table above it is now just R2.
Although, having said that, the intraday low on Thursday last week was 11944, so it was just as up to its task as it was back at the start of this expiry when it was at 12150.
The intraday low on Friday was 11888 so if it was left to its own devices R2 and R3 are evidently enough dynamic delta providing ratio to make the market sit up and listen.
The fact the real time close was 11950 is yet another one of those coincidences we so don’t believe.
The ratio alignment here still remains lopsided, but not nearly to the same degree anymore.
Furthermore, we still stand by our assessment that this index will be where the excitement will be, although London is certainly giving it a run for its money.
Range: 11850 to 11950 or 11950 to 12050
Activity: Moderate
Type: Bullish
Posted in Uncategorized
August 30th, 2018 by Richard

SPX , NDX & DJX Ratio Table 30th August 2018
Really very impressively aggressive from the SPX, and good to see it taking the lead for once.
We did mention a few bullish signs, one of which was that 2845-2855 may leapfrog 2820-2830 to becoming the next zone, and today it has done so, and although it hasn’t changed yet we don’t think it will be that much longer.
Also, in our last comment, we said we hadn’t seen any evidence of it being committed enough to take on the futures shaken out by the level of dynamic delta at R2, but we did on Tuesday.
The intraday high then was 2903.77, and it obviously couldn’t handle the futures then, but on Wednesday it blasted past them, so they have certainly upped the stakes.
Staying here is now going to be the difficult bit, as now it’s in the R2 ratio bandwidth it has to fight the same level of dynamic delta for every inch not just to get past it, so now comes the real test of the strength of their commitment.
Range: 2905 to 2930
Activity Moderate
Type: On balance just fractionally bullish
However, the prize for outright aggressiveness without a shadow of doubt goes to the NDX.
We didn’t particularly notice any hesitation at 7625 where R2 was lurking, and anyway it has gone so far past it is a somewhat moot point anyway.
Rather ironically none of the ratios have changed, so it is all down to the market, and whereas last time all we saw was money coming off the table, on both sides, today it is just one way.
The end result is we see R3 reappear, but what that may bring to the party when the market is in this mood it is impossible to say.
We have no idea what the news was, or is, but this is fundamentals taking over, especially as derivatives had left the door ajar, so there is very little these ratios can do under these circumstances.
Although, once the emotion drains away then the dynamic delta will remain, unless of course the ratios do start to collapse, and being in a R2 ratio bandwidth will come as a very unpleasant awakening.
Previously, under these similar conditions, we often see this index stuck in a 25-point corridor and depending on where it opens the top and bottom should be a multiple of 25.
Range: 7625 to 7750
Activity: Moderate
Type: Bearish
For all the aggressiveness coming from the SPX here in the DJX we are seeing more passiveness, which is a bit odd as it is normally exactly the other way around at this stage of an expiry.
In our last comment on the 28th August Y2 in the DJX was standing at 26100.
This is important as on Monday the intraday high was 26067, and on the Tuesday 26122.
This was the same Tuesday that the SPX hit R2 at 2905.
Both capitulated then, but it was the Wednesday that these two diverged, with the DJX going above 26100, and it did close marginally above it, but as you can see from the table above Y2 is now at 26400, so yesterday 26100 should not have been that much of an issue.
Whereas R2 in the SPX hasn’t changed and yet it blasted past it, ending up 0.57% compared to the DJX’s 0.23%.
Unless the DJX joins the SPX’s party, both are going to struggle to hold it up at these levels, as one faces a constant stream of futures of R2 magnitude coming onto their market, whereas here they obviously don’t feel comfortable with even Y2.
Range: 25100 to 26400
Activity: Average
Type: Bearish
Posted in Uncategorized
August 29th, 2018 by Richard

FTSE & DAX Ratio Table 29th August 2018
Our last comment on the FTSE was back on 22nd August so here is a quick reminder of what was said; “therefore 7550 is the all-important level now, as below it there is zero ratio until 7450, but at the other end if it can cope with 7600 (last 2 intraday highs 7616.15 & 7601.65) then it would reveal it is comfortable taking on Y2, which would then leave the way open to 7750”.
Essentially that was the story of last week in this index, as it satisfied itself bouncing around between 7550 and 7600.
London was closed on Monday so it seems it took the exuberant US to give the FTSE enough impetus to break through 7600 yesterday, despite it now being R1.
The fact the ratio has moved up doesn’t really change anything as 7750 is now R3, so in essence the differential is the same, its just the numbers are bigger, which is perfectly in keeping with a triple witching expiry.
At the end of the day the FTSE wasn’t comfortable in Y2 so it doesn’t look like that has improved any now it is in a R1 ratio bandwidth, despite the fact it is 200-points wide, giving it plenty of scope if it was.
Unless London grows a pair, it could easily find itself stuck again in a 50-point corridor as it struggles to cope with R1 ratio, and the activity reflects this problem, to us at least.
It is perhaps worth mentioning that although the type of activity is as below, were we to apply some discretion then we feel “not bullish” would perhaps be more appropriate.
Range: 7550 to 7750
Activity: Very poor
Type: Bearish
As we say above here is a little reminder of our last comment in the DAX;” well, in truth, the surprise was only for those who were unaware of how the ratios were aligned for this expiry….Our minor disappointment was we never saw a test of 11950, which has today changed from DR to R3, as that would have been really spectacular….However, it seems R2 at 12150 proved admirably up to the task, with the last three lows of last week coming in at 12120, 12168 and 12135 respectively”.
And if one casts one’s mind back to the rollover we suspect there were very few who had highlighted the possibility or potential for this index to bounce 400-points.
More importantly the ratios are still very lopsided as you can see, and if we do see from R2 to corresponding R2, then 12950 should now be entering on one’s radar.
First things first and it still has to get out of its zone first.
On Monday the intraday low was 12429 and the high 12562, which is a zone bandwidth test in anyone’s book.
So, the breakout should have been yesterday, and it did try, getting as high as 12597, but it is significant it closed back in its zone.
And not only that the real time close was +11.98, so it was the auction that wiped 22.87-points off this index sending it not only into negative territory but also to its low of the day.
Still 4-weeks to go, but there is no doubt that this index is still going to be far more exciting then London, which is also exactly what the rollover revealed.
Range: 12450 to 12550
Activity: Poor
Type: Neutral
Posted in Uncategorized
August 28th, 2018 by Richard

SPX , NDX & DJX Ratio Table 28th August 2018
And the good news is that there is still another 4-weeks of this to go as the penultimate “biggie” of this year does exactly as it should.
Albeit helped with a little nudge from the politico’s, but for those of a slightly more cynical nature an announcement of a possibility with no hard facts or figures justify a 40-point leap in the SPX? It has, so it does, but for us this was just the spark.
As we said last week “no real change in the ratios above the zone, but R1 has taken a right battering and is on strike 3 anyway, but below they are very much stronger, which is in fact bullish, so we suspect it won’t be long before we start talking about the zone moving up”.
This index has been knocking on the door all last week, and having eventually got past R1 on Thursday it stalled against R2, but at least it was trying.
Now, what happened is all very well but of of far more importance is what might happen next?
The ratios below are a little bit stronger, more of a tweak really, so neutral rather than bullish.
However, above the zone they are in full retreat, so we are indeed looking at a jump in the zone.
And we think it will bypass 2820-2830 and go straight to 2850-2860, which is bullish.
All told, we haven’t yet seen this market willing to buy all those futures shaken out by the dynamic delta at R2, so for the time being it looks like it will have to be content with just following it as it recedes as and when.
Range: 2880 to 2905
Activity Moderate
Type: On balance only just bearish
The NDX is surely proving to be an odd one this expiry.
When we last commented it had closed right on R1, which was then at 7425, and the close on the 22nd August was 7424.60.
The next day it gave up a bit of ground having made quite a deep incursion into R1 territory.
Of course, the ratios have changed considerably, and it is a little difficult to establish exactly when, but as R1 today is at 7500 then at least we know it was somewhere in between.
However, this does not portray the full picture as not only have the ratios slipped above the zone, but they have pretty much all dropped a level, the net result being R3 has gone completely.
Falling ratios in front of a rampant market is not unusual in this index, nor is the ceaseless addition of strikes that nobody seems interested in.
The really odd aspect is that the ratios have crumbled below the zone as well, not quite so dramatically for sure, but it is somewhat contradictory to the norm.
In fact, although activity come in as average, the really telling aspect is that it is money coming off the table, which is downright bizarre this early and after such a move. Makes 7500 a really critical, or key, level.
Range: 7500 to 7625
Activity: Average
Type: Neutral.
Looks like we have the answer to our question in the DJX, which is “game on”.
The only question now is how they will react to encountering Y2?
Having had that titanic battle with 25500 during the last expiry, and that was just the upper boundary of their zone with Y1 behind it, we did question how the market would cope with being in a Y1 ratio bandwidth at the start of this expiry.
The answer, of course, is easily, and they have marched straight up to Y2 in a matter of days.
The intraday high on Monday was 26067, which is very close to being strike 1, especially as it was at the end of a 277-point rally, but we think it is just a fraction too far away.
Casting one’s mind back to the rollover and it seems that the DJX has certainly fulfilled the potential it showed in that analysis, and it has now achieved in one week what it took the entire last expiry to do.
Range: 25100 to 26100
Activity: Poor
Type: Neutral
Posted in Uncategorized
August 23rd, 2018 by Richard

SPX , NDX & DJX Ratio Table 23rd August 2018
We do say that this first “extra” week in a 5-week expiry can be a bit tedious, but here in the SPX it has been far from it.
OK, on the surface, the market has gone nowhere, but if you are aware of the ratio levels you would also be aware of the titanic battle it is currently fighting.
On Monday R1 was at 2855, then as we revealed pre-market on the Tuesday via twitter it had slipped to 2865, which has proved to be the battleground for the last two days.
Now the interesting side effect of all this was yesterday there was no fear, or no put activity to speak of, and yet there was a lot of call money coming off the table, which is ridiculous this early in an expiry.
Then, today, we have seen about half return, but it is the put activity that is most surprising, as this is almost entirely responsible for “activity” below being “good”, and this in a triple would translate into a “very strong” in an intermediary, to put it into perspective.
No real change in the ratios above the zone, but R1 has taken a right battering and is on strike 3 anyway, but below they are very much stronger, which is in fact bullish, so we suspect it won’t be long before we start talking about the zone moving up.
But the question is whether or not this will be before all those nerves get the upper hand?
Range: 2805 to 2865 or 2865 to 2880
Activity Good
Type: On balance bearish
As we said on Monday “The NDX in Sept could be the deciding factor, and it has been a very long time since we have seen this potential here just by normal everyday activity”.
There has been an impressive increase in the ratios below the zone, but right from the rollover last week the start of the Sept expiry was always going to be about the ratios north of the zone.
Today R1 is 7425, although it could have changed yesterday of course, but there is no coincidence that the market finished right on it.
How brave are they going to be?
It has been a very long time since this market took on a R ratio and won, even longer without the big players wading in first as well.
Nothing is impossible, especially in markets, and fundamentals can sometimes outweigh derivatives for sure.
However, as a general rule of thumb, fundamental (or technical) inspired movement tends to last but a day or so, and unless the ratios capitulate, the dynamic delta, or futures selling in this instance, will eventually erode that emotion.
Range: 7325 to 7425 or 7425 to 7525
Activity: Average
Type: On balance just fractionally bearish
Unfortunately, the jury is still out on the DJX, as the problem we identified on Monday still persists.
Then we said “Will Y2 prove to be a problem, we just don’t know until it is tested, for the simple reason that they feel emboldened by eventually breeching 25500, so is that job done to them, or now game on?”
Monday didn’t really give us a clue as it traded in a 100-point range, from 25716 up to 25790, which is a bandwidth and a sign to us that they were not happy even in just Y1 ratio.
Altogether, hardly surprising, as for the last two expiries they have been in stupidly wide zones where there is no ratio to contend with.
Tuesday saw the high of 25888, undoubtedly a test of Y2, which was then at 25900.
So, its reaction since that test has been a natural enough recoil, but it has hardly been very far.
The reason for this is very likely the SPX continuing its battle to break through R1.
So, what needs to happen is for them both to start reading from the same page, the problem is which page will they join together on?
Please note Y2 has slipped to 26100.
Range: 25100 to 26100
Activity: Poor
Type: Bearish
Posted in Uncategorized
August 22nd, 2018 by Richard

FTSE & DAX Ratio Table 22nd August 2018
It has been a while since we last looked at the FTSE, the 14th to be precise, and there have been surprisingly few changes.
Although, this is one of the benefits of a triple, because the numbers are just so much more then change can be infrequent.
The added bonus of this is that it makes it very easy to remember, or to jot down the levels.
The pertinent ones we mentioned last time haven’t changed, being 7350 below the zone and possibly 7750, otherwise 7850 above it.
The other aspect is the zone itself, not too mention the gravitational influence it exerts, which is what we suspect the last two days have been all about.
Therefore 7550 is the all-important level now, as below it there is zero ratio until 7450, but at the other end if it can cope with 7600 (last 2 intraday highs 7616.15 & 7601.65) then it would reveal it is comfortable taking on Y2, which would then leave the way open to 7750.
Both levels are now on strike 2 please note, after the last two intraday lows of 7558.59 & 7557.34.
Range: 7550 to (7600) / 7750
Activity: Poor
Type: On balance bearish
Our last comment on the DAX, August 16th, was all about how lopsided the ratios were and that the September expiry may well hold a surprise.
Well, in truth, the surprise was only for those who were unaware of how the ratios were aligned for this expiry.
Our minor disappointment was we never saw a test of 11950, which has today changed from DR to R3, as that would have been really spectacular.
However, it seems R2 at 12150 proved admirably up to the task, with the last three lows of last week coming in at 12120, 12168 and 12135 respectively.
Yesterday saw this index bump its head on their zones bottom boundary, the intraday high being 12432, which may well introduce a degree of realism, after bouncing off R1 on Monday, with the intraday low of 12245.
The other cause for concern is what is happening across in the US markets with the SPX hitting R1 and the DJX hitting their Y2.
All in all, it is proving to be an exciting start to this expiry, which bodes well for the next few weeks, assuming one likes a bit of volatility that is.
Range: 12250 to 12450
Activity: Poor
Type: Bullish
Posted in Uncategorized
August 20th, 2018 by Richard
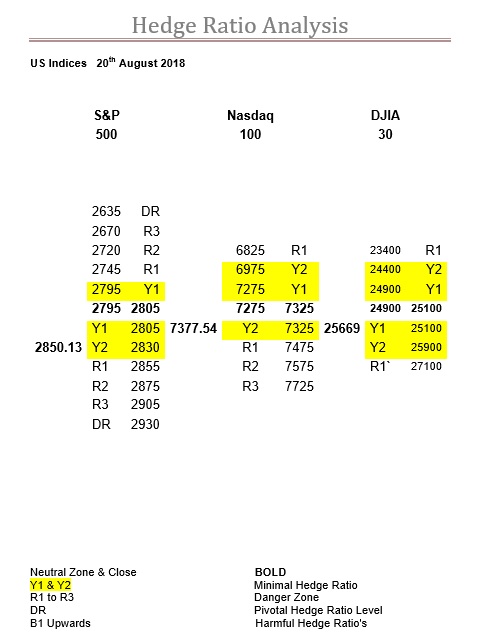
SPX , NDX & DJX Ratio Table 20th August 2018
It is nice to go back to one of the old school expiries for a change and not just in the SPX.
However, here, this meant last rollover Wednesday hitting their zone, leaving the Thursday and Friday to being what we used to call the grey area, where neither but both expiries are in charge.
Anyway, the upshot is, with those two grey days, we get an exciting start to September.
As just above this market, at 2855, lies R1.
At, or towards, the end of this expiry we would not expect this level of ratio to be more than say a speedbump, but right at the start it can prove to be far more potent, so it should prove an interesting test for this index, very probably when it is not expecting it at all.
Finally, we should mention that although activity only come in as average please don’t forget this is a triple so average is in fact very good.
Range: 2805 to 2855 or 2855 to 2875
Activity Average
Type: On balance just fractionally bearish
The NDX in Sept could be the deciding factor, and it has been a very long time since we have seen this potential here just by normal everyday activity, albeit this is a triple of course.
Basically, all the ratio movement has been above the zone, and it is of such that it should impact immediately.
The main point is that for a long time the NDX has struggled with Y2, but this hasn’t been that much of an issue as there has been plenty of Y1 to play around in.
However, this expiry kicks off with no Y1 now above the zone, so will this index react as it has been doing when it encounters Y2, or will it front up and treat Y2 as if it is the new Y1?
Either way, we should soon see, but just looking at the table above it is plain to see the depth of ratio now above the zone, and we can’t remember when we last saw R3 without the appearance of the big players.
We should also add that a lot of these ratios above the zone are at the high end of that levels range, so it wouldn’t take much to tip them over the threshold and up another level.
Interestingly our old friend 7475 looks like it is going to play a big role in Sept as well, so this is fast becoming a very significant level, far more than just R1 suggests.
Range: 7325 to 7475
Activity: Good
Type: Neutral
Our suspicion is the real problem for the Sept expiry will be the DJX.
Last Wednesday the DJX got as low as 24965, which was as close to dead centre of that expiries zone as you are likely to get.
The point being, is that throughout the last expiry we took great pains to point out how fixated this index was with the top boundary of their zone, 25500, so when the pressure was off in those last two grey area days we were not surprised at all to see it make a beeline straight back there.
The $100 question is now that we are in September is this still the agenda?
To further complicate matters we have reverted to the more standard form of zone, or one that is just a mere 200-points wide, which is now a very long way below where this market currently is.
So, they have already broken free of their zone here, actually they start above it so no actual need to break through anything, and they now face Y2 just ahead.
Will Y2 prove to be a problem, we just don’t know until it is tested, for the simple reason that do they feel emboldened by eventually breeching 25500, so is that job done to them, or now game on?
Range: 25100 to 25900
Activity: Average
Type: On balance fractionally bullish
Posted in Uncategorized
August 16th, 2018 by Richard

NDX Aug to Sept Ratio Rollover Table 16th August 2018
The NDX has been a difficult read this expiry, mainly because it kept making suggestions towards interest returning, and then when it eventually did materialise it was of insufficient or ambiguous quantity to discern whether it was the big players or not.
This index can do its own thing, but this time it looked like it was a team player, and in the first week it did bounce off their zones bottom boundary.
After the SPX had hit their R1 and retreated so did the NDX, so both in sync really, getting way below their zone, the trouble was is that this was when the DJX was being so stubborn with trying to break through 25500.
The DJX was definitely the odd one out, so this was good news for the bulls here, as it meant the expiry low was just 7158.78, which at that stage was over 100-points from the support of Y2.
There then followed a very impressive run up to the corresponding Y2, then at 7475, easily beating the SPX to their first resistance level.
For once, the zone here has stayed static, and we would like to say the fact it finished bang in the middle of it on the Wednesday was expected, but sadly it wasn’t.
If anything, we would have expected the zone to move up to meet a reluctant index begrudgingly stooping to meet it.
However, if the market did suffer a setback then this is the natural resting place.
Interestingly the middle of both the SPX and DJX’s zones are 2800 and 25000 respectively, and their lows yesterday were 2802.49 and 24965.
Obviously, we can’t claim to have spotted the low, so we will take the bottom of the zone, which was then 7275, up to Y2, which was 7475, and back to the middle of its new zone, 7350.
Not that impressive being just 5.92%, and the NDX can do better, but with the DJX upsetting everyone this was probably the best under these circumstances.
Range: 7325 to 7375
Activity: Average
Type: On balance decidedly bearish
September is already building up to look like it is going to be very interesting.
We say that as this index tends to favour the bullish tack, but this time the ratios are definitely loaded to the upside (i.e. Where the futures selling will be).
The issue may well come down to how active this triple is going to get, and whether Y2 will prove sufficient.
Generally, for a biggie this is not the case, so in the absence of any R ratios below the zone this makes for a very high-risk scenario, and at the same time, above the zone, R1 is already present at 7500.
Also, don’t ignore that here the zone is below August’s, at 7275-7325.
Of course, a lot can change in the next few days, but it might be worthwhile going back to our post on the 14th August regarding the rollover situation in the SPX, as if these two do stay in sync then if they find themselves hitting a ratio level at the same time, or thereabouts, they should reinforce each other.
Range: 7325 to 7425
Activity: Average
Type: Neutral
Posted in Uncategorized
August 16th, 2018 by Richard

DAX Aug to Sept Ratio Rollover Table 16th August 2018
Well at last the DAX has got going, shedding the “dull as dishwater” title and, dare we say it, eventually fulfilling its potential.
With so much Y ratio around it should have been having these big moves all along, so really this should be no surprise, as is the fact it happened in the rollover week.
What would be impressive, and depending on the remainder of this week, but the DAX could now also be on for a perfect expiry.
It started the August expiry in its zone, which was 12450-12550, and by the end of that week and the start of the second one it was attacking R1, which was then at 12850.
In fact, at exactly the same time the DJX was assaulting 25500 over three days, here their highs were 12848, 12860 and 12833 on those same days.
Then came the stagnation, although it persistently stayed above its zone, albeit just.
All this is now history as the last few days have seen this index now attack R1 below the zone.
Worth mentioning (if only for Sept) but at the start of Aug R1 was at 12150, and although it has crept up it has slipped back a bit now, as you can see from the above table.
Also slipping is the zone, which is now standing at 12350-12450, but with only a sliver of Y1 ratio left below it any further reduction is rather limited.
Nevertheless, it does give this index a realistic target to aim for and achieve that perfect expiry.
In a nutshell, from 12500 up to 12850, then down to the corresponding R1 at (say) 12200, before hopefully expiring above 12300.
Even without the grandstand finish that is a 1000-point round trip, or 8.22%, in an expiry we thought had gone to sleep.
Range: 12150 / 12200 to 12350
Activity: Average
Type: On balance just fractionally bullish
As we mention above it can be worthwhile making a note of these early levels as they will naturally fluctuate throughout the course on this expiry, which don’t forget is 5-weeks, as these can often prove to be the bedrock, as it were.
Again, we are forced to mention that this index can be a slow starter, even with just a day or so to go, but especially so sometimes in light of the “extra” week.
The reason is that despite this being a triple, which should automatically mean a huge increase in activity, this is not the case.
Although, that is not true entirely, as we can see it is the case one way, but certainly not the other.
Our Delta Ratio is standing at 33.9%, which is very bullish, but despite this, just one glance at the above table and it should immediately strike you where the high ratios are, and more importantly, are not.
At last, and as we should, we can see a B ratio, but below the zone the jump in the ratio level at 11950 is the really important level.
And, as one can see, no corresponding DR ratio above the zone, in fact, nowhere is even close, and don’t forget these ratios are exponential.
Could be quite a surprise in store for September.
Range: 12150 to 12250
Activity: Average
Type: Neutral
Posted in Uncategorized
