Nb. Our comment from the 03/08/22
Well, we obviously got our move down in the zone, but it was not so cut and dried as we believed back on the 2nd.
Essentially, we saw some strength come into the ratios, so we didn’t actually see the move down until yesterday, the 7th.
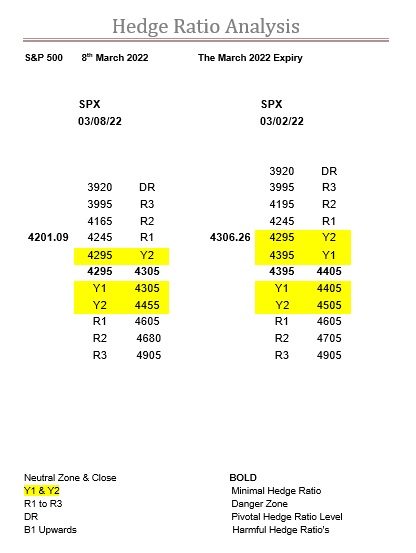
This was a bit of a surprise, especially under the circumstance, but considering the intraday low last Friday 4th was 4284.98 (Y2 was 4295) and the close was 4328.87 meant that despite the bounce off this minor ratio level, without the zone actually moving down, it resulted in the fact it was still in bear territory.
This was a shame, as it sort of scuppered our hope of the market getting back into bullish territory.
Of course, on Monday when it did move down, the market did as well.
Although, it is not all bad news, as the ratios continue to show signs of strength below the zone.
And, in fact, there is no longer any Y1 below the new zone…and don’t forget last week this index bounced off Y2 not once but twice. However, considering what is happening in the world, we suspect this is not really something to depend upon.
But it is nevertheless a good sign (please see previous comments), as is the fact that the ratios here have strengthened enough for the Y1 ratio bandwidth to shrink to 160, although overall it remains at 360-points.
Here, we would like to point out our comments on the FTSE as they are just as true here, albeit the SPX is behaving, so far at least, far more rationally than we would ever have imagined.
So, at the end of the day, the SPX is now in the R1 ratio bandwidth, with R2 now a relatively short distance away, so this market will experience some dynamic delta futures buying for certain. What they make of it is an entirely different matter, but the recent precedent is at least promising.
Range: 4165 to 4245
Activity: Moderate
Type: Neutral
Nb. Our comment for 03/16/22
Promising indeed…what an interaction with the ratio at 4165, and on the very day we published, the 8th March.
So, really, it couldn’t have turned out better for us, as not only did we highlight 4165, but the market spent over two hours finding this bottom (intraday low 4157.87), so it was very plain for all to see the dynamic delta in action, and in real time too.
Last week we also mentioned the FTSE and, for those in the know, they should have spotted the fact that while the UK was searching for its bottom with the ratio at 6950 so was the SPX with the ratio at 4165.
For the rest of last week, it was all about the zone and, in fact, the very next day, the SPX got as high as 4299.40, or to put it another way, the middle of its zone. Which in itself was a very impressive 135-point bounce, although perhaps these days we are getting numbed to such big moves.
Anyway, there was a bit of a tussle going on with whether or not the zone might make another downward move, to 4195-4205, which pretty much explains the price action on Thursday and Friday last week.
It is still a possibility, although at this stage of an expiry we would expect it to be far closer to being Y1 by now than it is.
So, perhaps a sort of outside hedge at best, or should that be worst?
As it is the rollover today, and as the market has bounced up to the zone, we couldn’t be happier. Especially as you couldn’t get a more strenuous test really.
We always say, that if the market is in or around its zone on the rollover, then that is job done and it has the next couple of days to do as it wants, but it is never as simple as that we acknowledge. Simply because it is just like giving a toddler a can of red bull and then expecting it to sit quietly, in this case in its zone.
And, sometimes, especially when its all been about support, you can lose sight of the fact that the R ratios above the zone don’t even start until 4605. So, we are glad it is here now, but with so much Y ratio still about, we very much doubt it will sit still.
Range: 4195 to 4295
Activity: Very poor
Type: On balance only just bullish