To be honest the upper boundary of the
zone when we last published was appallingly thin even for the minimal Y1.
In fact, so much so, in hindsight, we
probably should have made the zone 25000 all the way up to 26500.
The gap up at the open on Monday of
147-points to 26075 made all this irrelevant anyway.
As far as we are concerned 26500 will be
the all-important encounter, and if, or when, this happens and the DJX’s
reaction, will tell you all you need to know about the remaining week of this
expiry.
The fact that we have had just one
200-point and one 300-point daily move since the 28th is the bizarre
aspect, as with zero ratio, these types of move should be the starting point.
Again, whether it is in one direction,
or there and back, is neither here or there, it just should be a lot more
volatile than it actually is.
The potential is certainly there, and from the top of their zone to the bottom is an eye-watering 1000-points don’t forget.
Range: 25500
to 26500
Activity: Moderate
Type: Neutral
Nb. Comment on 04/12/19
The day after our last comment the DJX
hit the intraday high, and so far, expiry high, of 26487, or to us the top of
its zone.
It is worth noting that up to
yesterday’s close, 26143, this index has lost 344-points.
Apart from this being the top of our
trading range, it is also significant because the SPX in that time has only
retreated 4.92-points while the NDX has actually advanced 12.99-points.
Furthermore, what we said back on the 4th
is just as relevant today, and really this index should be seeing 200-point
daily moves as a matter of course.
Unlike the SPX, here there have been no
changes to the ratios, so this makes 26500 still a very significant level.
What we always say is please look at all three US indices, as when one hits one of its significant ratio levels it will naturally be affected, but this is magnified when two or all three hit their own levels at the same time.
Again, we wish the table above for the
NDX had been published back on the 20th, as just like the SPX and
the DJX there were significant ratio levels that had to be contended with.
For the NDX it was right from the very
start, as on that very first day this index closed right on Y2 at 7325.
And 7325 has been the constant theme for
the past two weeks, and if you knew it was where Y2 was, and hence all that
futures activity, then the last two weeks would have made a lot more sense.
Monday 18th the close was
7326.28, next day’s intraday low was 7321.93 having opened nearer 7360.
Wednesday’s intraday low was another
test, being 7318.42, then it tried to break free, but as you can see the ratios
were just not shifting, so by Friday it was back to Y2 with the close at
7326.06.
Of course, that was the day it dumped
167.21-points, so it probably would have been nice to know, that just like
London, it was an accident waiting to happen.
Although, having fought through the hard
yards, it is worth pointing out, and please see our previous commentary on this
subject, that the Thursday immediately before this big dump, the DJX was
hitting the top of their zone, intraday high 26009, and the SPX was meddling
with R2, with their intraday high of 2860.31.
This week, 7325, has been significantly
involved as well, suffice it to say Monday’s close was 7316.96 and yesterday’s
7320.47.
Nevertheless, at the end of the day,
here we are at the midpoint of this expiry, which incidentally, closes a day
early, and the ratios are still seriously underdeveloped.
So, just like the DJX, if this index
gets a head of steam up, which is very possible in the run up to the rollover
and expiry, it really could motor.
However, with R1 lurking up at 7600, and Y2 now in-between, it will find life a lot easier going south than it will north, but the bulls have already set out their stall, getting it as high as 7505.41, so they will have to be taken out first, and with the lack of ratio meaning a general lack of interest, that may not be so easy in itself.
Range: 7225
to 7325 or 7325
to 7600
Activity: Moderate
Type: Bearish
Nb. Comment on 04/12/19
The bulls had indeed set out their stall
and yes, indeed, they did get a “head of steam up”.
Actually, and on the very day we
published last, as you can see the previous close was 7320.47 from the left-hand
column in the table above, but that Friday the market gapped up at the open to
7377.77.
But the real defining moment was when it
came back down to Y2, with the intraday low of 7333.17, and the fact it bounced
off Y2 meant the bulls really were back in the saddle.
Of course, we don’t know exactly when R1
slipped from 7600, but we suspect it was only recently as the intraday highs
from the 3rd all the way through to Tue 9th of 7589.69,
7571.13, 7581.90, 7602.08 and 7596.75 suggest it didn’t give way until
Wednesday.
All very punchy, but what we said above,
back on the 29th March, is just as relevant today; “and the ratios
are still seriously underdeveloped….. and with the lack of ratio meaning a
general lack of interest, that may not be so easy in itself”.
The only difference this time round is
that next week it is the rollover and the expiry, so time is very short indeed,
and as it’s a long weekend quite a few will probably get going early.
At the end of the day, there is still so little ratio about the zone will move northwards no doubt, and substantially so, but nevertheless this index should be seeking the Y1 ratio bandwidth, at least, by the rollover.
At the start of this week the intraday
high on Monday was 2869.40, so we suspect the hitherto unchanged R2 was still
at 2865.
However, that day the market closed at
2867.19, which is a fairly blatant sign that either the market had breached R2,
or, and more likely, that it had slipped.
Today, it is at 2885, and as yesterday’s
intraday high was 2885.25, it’s a fair assumption that it was here then.
Obviously, it is slipping, and this index
just keeps banging on that door until it opens and move back to the next line
of resistance.
It will probably hold in the morning,
but we would be rather more circumspect later on.
2895 is the next R2 line of resistance,
but 2905 is where it takes a big step-up.
But, don’t forget, next week is the
rollover and expiry AND it is a 4-day week.
And, more importantly, the zone is still
way down at 2795-2805, and is sandwiched in a sea of Y ratio, so if someone
says “boo” to this market, there is no support underneath for a very long way
indeed.
However, as always, best to keep an eye on the DJX as they seem to be the ones happy to force the pace.
Range: 2860
to 2885
Activity: Poor
Type: On balance just bearish
Nb. Our comment on 12/04/19
Since our last comment on the 4th
it has indeed been all about R2, which back then was at 2885 as you can see in
the left-hand column in the above table.
Furthermore, exactly as we also said
back then (please see above comment), this ratio was slipping, so if you had
taken notice then all the price action in this index over the last week would
have been perfectly understandable.
The top of the DJX’s zone was 26500, and
their intraday high, and so far, expiry high, back on Friday 5th was
26487.
So, taking yesterdays close the DJX has
lost 344-points, whereas, here in the SPX, it is down just 4.92-points.
As we said “it just keeps banging on
that (R2) door” and we even mentioned 2995, so really you just can’t get better
than that.
What we did get wrong however, was that
the rollover and expiry wasn’t “next week” it is now next week.
But worth noting that R2 is now 2925,
but there is what we call a step-up at 2905, which was R2 in-between publications.
The SPX has laid out its stall, and we
believe it will still be sensitive to a still receding R2, so, for us, it all
now boils down to the DJX, and the top of its zone, and the NDX.
The fact that the rollover and expiry are large on the horizon also means this market is still very susceptible to anyone saying “boo”.
It is a real shame we didn’t publish
last week, as it was blatantly obvious to us the FTSE was an accident waiting
to happen.
The only surprise was that the FTSE got
as far as it did, and 7350, or R3 to us, played a pivotal role last week.
The intraday high on Tuesday was
7350.10, on Wednesday it got up to 7341.57 for its second attempt, and then on
Thursday, strike 3, it peaked at 7370.61.
However, the most telling aspect was the
close on Thursday at 7355.31, and the fact that R3 wasn’t retreating, so the
bulls were certainly keen, but, as we say, it was an accident waiting to
happen.
Of course, had the other markets not
been in similar circumstances, then the FTSE may well have gone on to test DR,
but then it’s all about risk and reward.
Which to us, with a 200-point Y ratio
bandwidth above a zone that is way down there at 6950-7050, the risks were
certainly at the top end of the scale.
7250 is now the new critical level.
Range:
7050 to
7250
Activity: Average
Type: On balance bearish
Nb. Our comment on 04/09/19
And we were not wrong as 7250 dominated
this index for that week, until Friday 29th when it managed to hold
on for that all important close above it, at 7279.17.
The trouble is that when we last
commented on the FTSE, an entire 10 trading days ago, the ratio landscape has
transformed.
There is absolutely no point in guessing
when, so we are just going to fast-forward to the end of the next week, Friday
the 5th April, when the close was 7446.87.
More importantly, the intraday high was
7461.39, so we strongly suspect that was this index’s first pop at R3.
However, we would be remiss not to point
out how huge the changes have been, and in fact, so much so, they have virtually
flipped 180 degrees from the 25th March.
Although there is now Y2 above the zone,
what was there back on the 25th is now below the zone, which itself
has leapt 200-points to 7150-7250.
But, the real clincher, is B1 has gone
from above the old zone to now being below it, which signifies that the entire
ratio alignment has totally adjusted.
No wonder it has managed to eventually
achieve what it was threatening to in that very first week.
We would fully anticipate 7450 to slip
to R2, leaving 7500 as the next resistance level.
If this is the case then the trading
range should be 7400 to 7500.
Then, it will be all down to the rate of change in the ratios, especially as the clock is ticking and the expiry is now fast appearing on the horizon.
The SPX mirrors our sentiment from
London, as we wished we had published last week, although it was perhaps not
quite so compelling here.
Although, when one gets to see all three
US indices together, then the argument becomes more convincing.
The pertinent bit is that R1 back on the
20th was at 2845, and that very day, after we had published mind,
the intraday high was 2843.54.
Today, R1 is at 2855, but as the
intraday highs on Thursday and Friday last week were 2860.31 and 2846.16
respectively, so we suspect that change has happened this week.
Worth noting that R2 has been at 2865
throughout.
No harm in the bulls being aggressive,
but ultimately, they will have their limit as to how many futures they can buy
that have been forced out due to the dynamic delta.
This trip, this looks like R2.
So, what else can the ratios tell us?
The upside is what you can see, but
below the zone there is another story altogether.
If there was a strong bullish upswell we
would expect the ratios down here to strengthen (come in), so we are nervously
watching Y2 weaken (move out) to 2720.
R1 has held its own at 2695, but if the
bulls were in total control, as we say, that should be rising.
This, also, throws up the intriguing
possibility of the zone moving down to 2770-2780, which would be bearish of
course.
So, to us, it is not all bullish here,
and with 150-points of Y ratio still, the risks are plain for everyone to see.
But, as always, in the US, it best to check if the DJX has an agenda first, as you can’t escape the correlation naturally.
Range: 2805
to 2855
Activity: Average
Type: On balance just bearish
Nb. Our comment on 04/04/19
The SPX is still all about R2.
At the start of this week the intraday
high on Monday was 2869.40, so we suspect the hitherto unchanged R2 was still
at 2865.
However, that day the market closed at
2867.19, which is a fairly blatant sign that either the market had breached R2,
or, and more likely, that it had slipped.
Today, it is at 2885, and as yesterday’s
intraday high was 2885.25, it’s a fair assumption that it was here then.
Obviously, it is slipping, and this index
just keeps banging on that door until it opens and move back to the next line
of resistance.
It will probably hold in the morning,
but we would be rather more circumspect later on.
2895 is the next R2 line of resistance,
but 2905 is where it takes a big step-up.
But, don’t forget, next week is the
rollover and expiry AND it is a 4-day week.
And, more importantly, the zone is still
way down at 2795-2805, and is sandwiched in a sea of Y ratio, so if someone
says “boo” to this market, there is no support underneath for a very long way
indeed.
However, as always, best to keep an eye on the DJX as they seem to be the ones happy to force the pace.
Again, we wish the table above for the
NDX had been published back on the 20th, as just like the SPX and
the DJX there were significant ratio levels that had to be contended with.
For the NDX it was right from the very
start, as on that very first day this index closed right on Y2 at 7325.
And 7325 has been the constant theme for
the past two weeks, and if you knew it was where Y2 was, and hence all that
futures activity, then the last two weeks would have made a lot more sense.
Monday 18th the close was
7326.28, next day’s intraday low was 7321.93 having opened nearer 7360.
Wednesday’s intraday low was another
test, being 7318.42, then it tried to break free, but as you can see the ratios
were just not shifting, so by Friday it was back to Y2 with the close at
7326.06.
Of course, that was the day it dumped
167.21-points, so it probably would have been nice to know, that just like
London, it was an accident waiting to happen.
Although, having fought through the hard
yards, it is worth pointing out, and please see our previous commentary on this
subject, that the Thursday immediately before this big dump, the DJX was
hitting the top of their zone, intraday high 26009, and the SPX was meddling
with R2, with their intraday high of 2860.31.
This week, 7325, has been significantly
involved as well, suffice it to say Monday’s close was 7316.96 and yesterday’s
7320.47.
Nevertheless, at the end of the day,
here we are at the midpoint of this expiry, which incidentally, closes a day
early, and the ratios are still seriously underdeveloped.
So, just like the DJX, if this index
gets a head of steam up, which is very possible in the run up to the rollover
and expiry, it really could motor.
However, with R1 lurking up at 7600, and Y2 now in-between, it will find life a lot easier going south than it will north, but the bulls have already set out their stall, getting it as high as 7505.41, so they will have to be taken out first, and with the lack of ratio meaning a general lack of interest, that may not be so easy in itself.
Well for the DJX it certainly is back to
basics and we are seeing again a typical post triple type expiry.
Or, to be more exact, with nothing
happening.
And, more to the point, by comparing the
20th to the 28th you can see how very little has changed.
And the most important constant was
evidently the top of the zone here, 26000, as, so far at least, it has caught
the intraday high as well as the expiry high, of 26109.
Worth noting, is on that day this index
closed at 25887, and that two days later it went back for another bite, with
the intraday high of 26009, before again capitulating.
However, the most important aspect is
that the zone is still a massive 1000-points wide.
So, all well and good when it is all
relatively peaceful and calm, but in the build up and into the rollover and
expiry, if this doesn’t change, then volatility could come storming back with a
vengeance.
So, all you traders out there, start
sharpening your knives.
On top of which, and this also relies on the other US indices, that if it does gain traction and momentum, then that is a wickedly wide Y Ratio bandwidth, so it really could cut loose, in either direction or just whipsaw very violently.
The SPX mirrors our sentiment from
London, as we wished we had published last week, although it was perhaps not
quite so compelling here.
Although, when one gets to see all three
US indices together, then the argument becomes more convincing.
The pertinent bit is that R1 back on the
20th was at 2845, and that very day, after we had published mind,
the intraday high was 2843.54.
Today, R1 is at 2855, but as the
intraday highs on Thursday and Friday last week were 2860.31 and 2846.16
respectively, so we suspect that change has happened this week.
Worth noting that R2 has been at 2865
throughout.
No harm in the bulls being aggressive,
but ultimately, they will have their limit as to how many futures they can buy
that have been forced out due to the dynamic delta.
This trip, this looks like R2.
So, what else can the ratios tell us?
The upside is what you can see, but
below the zone there is another story altogether.
If there was a strong bullish upswell we
would expect the ratios down here to strengthen (come in), so we are nervously
watching Y2 weaken (move out) to 2720.
R1 has held its own at 2695, but if the
bulls were in total control, as we say, that should be rising.
This, also, throws up the intriguing
possibility of the zone moving down to 2770-2780, which would be bearish of
course.
So, to us, it is not all bullish here,
and with 150-points of Y ratio still, the risks are plain for everyone to see.
But, as always, in the US, it best to check if the DJX has an agenda first, as you can’t escape the correlation naturally.
It is a real shame we didn’t publish
last week, as it was blatantly obvious to us the FTSE was an accident waiting
to happen.
The only surprise was that the FTSE got
as far as it did, and 7350, or R3 to us, played a pivotal role last week.
The intraday high on Tuesday was
7350.10, on Wednesday it got up to 7341.57 for its second attempt, and then on
Thursday, strike 3, it peaked at 7370.61.
However, the most telling aspect was the
close on Thursday at 7355.31, and the fact that R3 wasn’t retreating, so the bulls
were certainly keen, but, as we say, it was an accident waiting to happen.
Of course, had the other markets not
been in similar circumstances, then the FTSE may well have gone on to test DR,
but then it’s all about risk and reward.
Which to us, with a 200-point Y ratio
bandwidth above a zone that is way down there at 6950-7050, the risks were
certainly at the top end of the scale.
The real test was on Thursday 14th
Feb when the intraday low was 25308, but more importantly, the close was 25439,
so the fact it was fought over and the bulls won tells its own story.
The first point to address is the fact
that last time the zone was 24400-24600, but at that very same time, the Feb
expiries zone was 25100-25400, so March just basically joined Feb’s, so no
surprise or drama there.
Fast forward to the current, and
although R1 is at 26200, it is plainly obvious to us this has been fighting a
tactical retreat, and at least from 26100.
26100 was where R2 was back in the
rollover, so has always been a significant level.
Anyway, seeing this means we now
perfectly understand why the DJX’s intraday highs since Friday have been 26052,
26241, 26155 and 26039.
Also, why the close on those days have
been 26031, 26091, 26057 and 25985.
We don’t see the move up in the zone
here as bullish, more like a correction, but the receding R ratios are,
although the failure of this index to surmount the futures selling generated by
the dynamic delta isn’t.
On top of which, the Y ratio bandwidth
is now 2800-points wide, so the ratios certainly are not filling in underneath.
So, just like the SPX, we are exceedingly nervous….and still two weeks to go.
Range: 25300
to 26200
Activity: Moderate
Type: On balance bearish
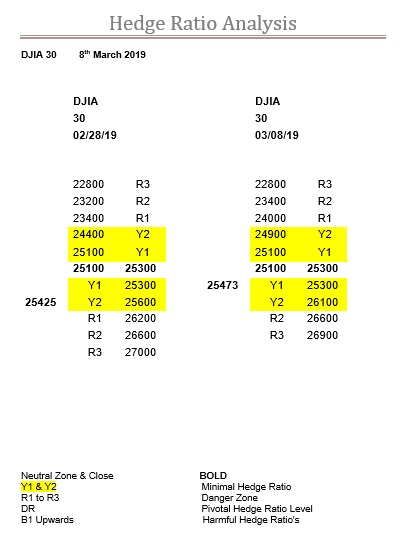
Nb. Comment from 03/08/19
The most pleasing aspect about our
comment back on the 28th February was our trading range of 25300 to
26200.
Since then, the intraday high has been
26155, and the intraday low from yesterday was 25352, and you can’t say fairer
than that.
Actually, you can, as back when this
index was persistently trying to get above R1 our zone was lurking down at
25100-25300 (hence the bottom of the range of course) and not many would have thought
that just before the rollover this index would be even close.
Anyway, we are not counting our
proverbial chickens yet, as the observant will have noticed that in today’s
ratio table above, R1 has gone, leaving R2 at 26600 as the new first line of
resistance.
This will bring a whole new level of
significance to the zone, and perhaps 25100.
First up, of course, it has to get back
into its zone, and it might even be willing to relax in it until the rollover
on Wednesday.
If not, then, in one of those
potentially seminal moments, whether it breaks out above (bullish territory),
or below and into bear territory.
We are not going to guess what will happen, but you now know the significance of 25300 and also 25100, so you can react accordingly.