It is very difficult to appreciate that
this is in fact a triple witch expiry, or quadruple as the US likes to call
them, as the activity remains so low.
The level overall is much more befitting
a biggie, but it all looks passive.
And, we are back to that ridiculously
wide zone.
However, and as we pointed out, the
bottom boundary is hugely significant.
Last Thursday, the 23rd, this
index got as low as 25328 before finishing at 25490.
At the time we mentioned how
statistically irrelevant 10-points is on a twenty-five-thousand-point index,
and the opening gap up the next day just went to underline this.
The fact that the next day, Friday, the
intraday low was 25496, was also very telling.
So, yesterday, it was looking good, but
right towards the end the market got spooked, and, hey presto, strike 3.
The only good news is that the next
level of support is actually rather close, and it jumps straight in at R2,
please see above table.
Otherwise, it’s going to be all down to
the SPX, please see our previous comment on the 21st May, and from
our calculations on the 28th R2 here is still at 2770.
The expiry still has a very long way to
go, but it is heating up nicely, and now we are testing levels, both in this
index, the DJX, but also the SPX, this will ignite activity, if only because of
the dynamic delta, so the fun starts now, for us at least.
Nb. Our comment from 05/17/19 (Not published online)
Range:
Activity:
Type:
Nb. Our comment on 05/22/19
The FTSE is a classic example of the
expiry of one month (May) leaving another (June) in a difficult position.
For May, where the zone was 7350-7450 at
the end, it was a tremendous achievement for this index to claw itself all the
way back up from R1 at 7150 (intraday and expiry low 7150.89 13th
May) to get to consecutive closes of 7353.51 and 7348.62 on the final two days.
Well done.
The trouble, as is plain to see, that in
June the zone was, and still is, 7150-7250.
And just to compound that, the ratio
above it is already R3.
So, June has been born into a very high
level of ratio.
No wonder it doesn’t know which way to
turn.
Will it be necessary for this index to
test DR at 7450, who knows?
As it stands, to us it doesn’t appear as
if it has the bottle, as 7350 seems to be a tough hurdle, and this is only R3,
which is what it’s in anyway.
It is not beyond the realms of
possibility, but, as is also very plain to see, the ratios above the zone are
far far greater than those below it.
Therefore, if it does, and 7550 is not
impossible, as triples often go between the B ratios, or at least did a while
back, we see this as only deferring the inevitable.
The real issue for us, in the five weeks
that lie ahead in this expiry, is whether the bottom boundary of the zone will
hold.
As, looking at it as it stands, the next
ratio support level doesn’t kick in until 6950.
And, as this index is already ploughing
through R3, then we doubt R2 will provide that much support.
The next few days should clear things up a great deal, but if we are to get a DR to DR expiry, and don’t forget May traded between the R ratios, you could be looking at a range of 600-points, which definitely deserves a wow wee.
Nb. Our comment from 05/17/19 (Not published online)
Range:
Activity:
Type:
Nb. Our comment on 05/21/19
In our last comment covering the May
expiry we said we expected to see the zone there finish at 2845-2855, which it
duly did.
The reason we mention this, is because
this expiry, the June triple, is still at the old level, but this is purely due
to the fact that these “biggies” just aren’t so nimble on their feet.
So,
even though it hasn’t changed, please take it for granted that the zone here
should be 2845-2855.
And, although it has just been two
trading days, since we last looked at the ratios there have not been many
changes.
Therefore, the fact that so much Y ratio
persists below the zone is not a good thing, and until the zone changes, this
will retard development undoubtedly.
Also, don’t forget this is a five-week
expiry.
Put these two elements together, and you
will, and currently do, have, 135-points of Y ratio.
And in a triple.
To put this into perspective, normally
we would not expect to see any at all.
On top of this, you should be aware that
the serious R ratios below the zone, do not start until the low 2700’s, and
then, they only go up to R3, an incredibly long way shy of the B level ratio we
would expect to see in a triple.
Above the zone, it is slightly better,
but it still only gets as high as DR ratio, so far from ideal.
So potentially a fantastic trading
expiry, but for asset managers probably a worst-case scenario, as with the
trading range in the Y ratio alone of 2795 all the way up to 2930, you have
nigh on a 5% range.
Assuming this is one-way, as more than
likely, just as in May, it will be one way, than a reverse to cover the other
way, before reversing again for the finish, so easily 10%.
Get your timing wrong when you are considering this degree of percent and it will not look pretty, but for traders, it should be great fun.
Already it seems the zone here in the
FTSE is having a major impact.
On Friday last week the intraday high
was 7442.39, and we are more than happy to call that strike one of the zones upper
boundary.
And, yesterday, the market basically
camped out on it for the last two and a half hours of the trading day, so
definitely strike two.
For the record the actual intraday high
was 7456.49.
Interestingly, the ratios above and
below the zone have slipped.
Below R2 slides to 6900, whereas above
both R3 and DR move out by 50-points.
Nevertheless, the situation remains the
same, as in we believe the best place for this market is in its zone (7350 to
7450), as above it R2 is still waiting to ambush it at 7550, whereas below we
don’t even see the R ratios start until 7050.
So, all in all, if it can hold within its zone, we think it will be doing well, as if it gets aggressive it could easily get a bloody nose, and if that shakes loose the bears then it is a long way down before it will find any ratio support.
Range:
7350 to
7450
Activity: Moderate
Type: On balance not bullish
Nb. Our comment on 05/13/19
As you can see from our comments above,
back on the 30th April, the market was all about the upper zone
boundary at 7450.
At that time, we hoped it would stay
within its zone, and it almost did, as the remainder of that week, it was all
about the lower zone boundary.
The intraday high on the 30th
was 7451.32, then on the 1st it was 7446.46, followed by a spike
down to 7339.45 but the close on the 2nd was at 7351.31, and most of
that day was spent in or around the lower zone boundary.
The intraday low on that Friday was in
fact 7350.01.
Of course, our fear about breaking out
of its zone was because back then it was all Y ratio down to 7050.
Needless to say, the ratios evolve, so
in the two weeks since our last comment you can see how much it has changed by
just comparing the two tables above.
It hasn’t quite got down to 7150, and it
would be nice if it did, but after the SPX got as low as 2825.39, incredibly
close to where we had our R1 and an astonishingly close call considering we
stated that was our level for the bounce when that market was nigh on 2900,
before finishing up 11-points at 2881.40, we suspect London has had its chance.
This week it’s the rollover, so the focus should be on recapturing its zone, so our old friends and acquaintances 7350 and 7450 will, or should be, back in the frame this week.
It has been a very long time since we
last commented on the DJX, but eventually we are seeing those daily 200-point
moves we have been expecting.
Of course, this was back in the last
expiry, but as you can see from the above table the zone is still huge, so naturally
we would be expecting the same in the May expiry.
The interesting part though, has been
how close it has stayed to the centre of its zone, namely 26500, as in two
entire weeks the furthest it has strayed is the measly 200-points.
Worth noting, the last fortnight closes
in chronological order were, 26511, 26656, 26597, 26462, 26543, 26554, 26592,
26430, 26307 and 26504.
And we are already at the mid-point of
this expiry, so the rollover actually starts next week, so we rather doubt
things will remain so unadventurous.
Also, worth noting, is this index is
very similar to the SPX, in that there is an awful lot of Y ratio should it
test and breach its zones lower boundary.
This makes 2895 and 26000 both critical
levels.
So, make sure and watch out for confluence, where they both test their respective levels at the same time.
Range: 26000
to 27000
Activity: Average
Type: Neutral
Nb. Comment on 05/10/19
Wow. In a word.
Never ceases to surprise do the ratios
and when we last looked (6th May) we thought the zone was
ridiculously wide then, so we just don’t have the words to describe what it is
now.
Obviously, since our last comment, here
in the DJX the crucial level was 26000, being the bottom of the zone back then,
so Tue and Wed price action was very important.
The close on the 7th was
25965, so right on the boundary, and, as it turns out, crucial it was those few
points on the wrong side.
Wed saw an intraday high of 26118, so
nice try, but the close at 25967, again shows it on the wrong side, albeit
just.
Of course, now it’s no longer an issue,
and this index has an astonishing 2000-points of zero ratio to play around in
now.
So, basically strap yourself in, as this
combined with the rollover next week, means for us, quiet it won’t be.
Perhaps worth pointing out that activity is high because the benchmark is still exceedingly low, although with such a wide zone that’s pretty obvious.
Well it has certainly been bit of a
quiet start to the May expiry, although things could become far more
interesting now the market is just below a test of R1.
The only change in the ratio above the
zone is Y2 comes in ever so slightly.
Below the zone there are two changes, Y2
comes in to 2815 and R1 to 2775.
However, neither of these are
significant enough to change the overall picture as there is still a sea of
minimal Y ratio below the zone that stretches for 120-points.
Don’t forget, when you add in the zone
itself and the Y ratio above it that is another 60-points.
So, the fact remains, this market
remains very susceptible to any shocks, to the tune of almost 6%.
First things first, and a test of R1 at 2955 would go a long way to establishing what this market really thinks, as bumbling around in the Y ratio like it has been, doesn’t mean anything, well apart from a large degree of apathy.
Range: 2905
to 2955
Activity: Moderate
Type: On balance bearish
Nb. Our comment on 05/09/19
A lot has happened since our last note,
most notably was the test of R1 at 2955, with the intraday high of 2954.13 on
the 1st May, followed swiftly by someone saying “boo”.
For those that had taken a note of our
last ratio table then they would have seen the normal pattern emerge.
Being, down to the middle of the zone,
intraday low 2900.50 before a decent recovery, but knowing where R1 was, not
going there again.
Then, this week it has all been about
the zone, intraday low on Monday of 2898.21 was a test of the lower boundary,
please don’t forget the Vega as the open was nigh on the upper boundary and
that represented a drop of 36.75-points in itself.
2895 and 2905 saw considerable action
the next day, but didn’t provide any highs or lows.
The most significant aspect that day was
the close at 2884.05, just a smidgen shy of their lower boundary, but still a
close in bear territory (i.e. below the zone).
Reinforced by the intraday high on the
following day, Wednesday, being 2897.96, a valiant but ultimately a failed
attempt to recapture the zone.
Which brings us neatly around to today,
and it is really good to see the ratios below the zone improving, and perhaps
no surprise the intraday low yesterday was 2873.28.
This makes Y2 critical today of course, but for us, our eyes are on the corresponding R1 ratio level now at 2815, as that for us will be key.
Nb. Our comment from 04/26/19 (Not
published online)
Despite the fact we last published on
the 15th here in the FTSE it has only been seven trading days, but,
of course, in those seven we have started an entirely new expiry, May.
The fact that this market is inside its
zone is a very good thing we feel, giving it room to breathe and move, without
having to test any ratio levels.
It was interesting to see the intraday
highs on the first two days of this expiry being 7528.93 and 7523.79, which, as
you can see from the table above, is tantalisingly close to a test of R2.
This is made all the more significant as
that is a big jump from the minimal Y ratio straight into the mid R ratio,
which don’t forget are exponential.
The real aspect to watch out for is any
breach of the bottom boundary, at 7350, as that is an awful lot of Y ratio
below there.
All the way down to 7050 in fact, a
rather worrying 300-points.
Also, noteworthy, is the similarity to
the SPX, in that there is a lot of Y ratio below their zone as well.
Activity, especially for May, and it being an intermediary to intermediary expiry, is surprisingly high, but, overall, it is still a very lopsided expiry and one that is still very underdeveloped.
Range:
7350 to
7450
Activity: Very strong
Type: Neutral
Nb. Our comment on 04/30/19
Already it seems the zone here in the
FTSE is having a major impact.
On Friday last week the intraday high
was 7442.39, and we are more than happy to call that strike one of the zones
upper boundary.
And, yesterday, the market basically
camped out on it for the last two and a half hours of the trading day, so
definitely strike two.
For the record the actual intraday high
was 7456.49.
Interestingly, the ratios above and
below the zone have slipped.
Below R2 slides to 6900, whereas above
both R3 and DR move out by 50-points.
Nevertheless, the situation remains the
same, as in we believe the best place for this market is in its zone (7350 to
7450), as above it R2 is still waiting to ambush it at 7550, whereas below we
don’t even see the R ratios start until 7050.
So, all in all, if it can hold within its zone, we think it will be doing well, as if it gets aggressive it could easily get a bloody nose, and if that shakes loose the bears then it is a long way down before it will find any ratio support.
Nb. Our comment from 04/25/19 (Not
published online)
As this is our first coverage of the May
expiry there is no previous comment.
However, in our final comment for April
we stated “Our money is on it shifting to
2895-2905, as back at the start of this expiry this was R2, nudging on R3, so
that is a precipitous fall in the ratio down to Y1”, in respect of the
zone.
So really there should be no surprise
where May’s zone is, or the fact the expiry last Thursday was 2905, right on
the upper boundary.
As we said back then, the SPX does not
seem to have any emotions, bullish or bearish, it seems to be curve-fitting
more than anything else.
However, in doing so it has just made
the situation even worse, as there is now even more minimal ratio below the
zone.
Of course, it needs something to cry
“BOO!” and catch the market by surprise, but if that does happen then it is
worth being aware that R1 below the zone doesn’t even appear until 2770, well
over 100-points away.
It remains to be seen if this index will resume knocking on the door of R2 as it hasn’t even tested R1 at 2955 yet, and we suspect, this will depend on whether either of the other two have an agenda this trip.
Range: 2905
to 2955
Activity: Good
Type: On balance bearish
Nb. Our comment on 04/29/19
Well it has certainly been bit of a
quiet start to the May expiry, although things could become far more
interesting now the market is just below a test of R1.
The only change in the ratio above the
zone is Y2 comes in ever so slightly.
Below the zone there are two changes, Y2
comes in to 2815 and R1 to 2775.
However, neither of these are
significant enough to change the overall picture as there is still a sea of
minimal Y ratio below the zone that stretches for 120-points.
Don’t forget, when you add in the zone
itself and the Y ratio above it that is another 60-points.
So, the fact remains, this market
remains very susceptible to any shocks, to the tune of almost 6%.
First things first, and a test of R1 at 2955 would go a long way to establishing what this market really thinks, as bumbling around in the Y ratio like it has been, doesn’t mean anything, well apart from a large degree of apathy.
Since our last comment on the 4th
it has indeed been all about R2, which back then was at 2885 as you can see in
the left-hand column in the above table.
Furthermore, exactly as we also said
back then (please see above comment), this ratio was slipping, so if you had
taken notice then all the price action in this index over the last week would
have been perfectly understandable.
The top of the DJX’s zone was 26500, and
their intraday high, and so far, expiry high, back on Friday 5th was
26487.
So, taking yesterdays close the DJX has
lost 344-points, whereas, here in the SPX, it is down just 4.92-points.
As we said “it just keeps banging on
that (R2) door” and we even mentioned 2995, so really you just can’t get better
than that.
What we did get wrong however, was that
the rollover and expiry wasn’t “next week” it is now next week.
But worth noting that R2 is now 2925,
but there is what we call a step-up at 2905, which was R2 in-between
publications.
The SPX has laid out its stall, and we
believe it will still be sensitive to a still receding R2, so, for us, it all
now boils down to the DJX, and the top of its zone, and the NDX.
The fact that the rollover and expiry are large on the horizon also means this market is still very susceptible to anyone saying “boo”.
Range: 2805
to 2885 or 2885
to (2905) / 2925
Activity: Poor
Type: On balance bearish
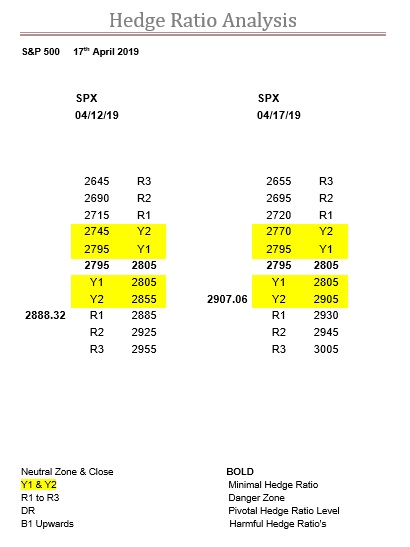
Nb. Our comment on 04/17/19
Well it never really managed to become
as courageous as it was, and therefore never really challenged R2 again.
In our last note R2 was at 2925, and as
you can see today it has barely shifted, now residing at 2945.
Nevertheless, in the intervening period,
the highest this market has got was intraday and 2916.06.
But, although R2 hasn’t moved much, the
really significant move has been the huge expansion of the Y ratio bandwidth,
which now stretches all the way up to 2930.
The fact the ratios have hardly filled
in underneath, means this is more by default, or by a distinct lack of interest
either way really.
The end result, is that the zone could
easily flip to anywhere in the Y1 ratio bandwidth, and probably even Y2, the
ratios are receding so fast.
Our money is on it shifting to
2895-2905, as back at the start of this expiry this was R2, nudging on R3, so
that is a precipitous fall in the ratio down to Y1.
Admittedly, this index has been knocking
on the R2 door, each time forcing it higher, but it hasn’t really filled in
underneath, and leaving the zone to move right at the end is more about
curve-fitting than rampant bullishness.
So, this index is still very scarily susceptible to anything going “boo”, but in the absence of such it is in default mode, trudging higher without any conviction that we can discern. In fact, quite the opposite.
And we were not wrong as 7250 dominated
this index for that week, until Friday 29th when it managed to hold
on for that all important close above it, at 7279.17.
The trouble is that when we last
commented on the FTSE, an entire 10 trading days ago, the ratio landscape has
transformed.
There is absolutely no point in guessing
when, so we are just going to fast-forward to the end of the next week, Friday
the 5th April, when the close was 7446.87.
More importantly, the intraday high was
7461.39, so we strongly suspect that was this index’s first pop at R3.
However, we would be remiss not to point
out how huge the changes have been, and in fact, so much so, they have
virtually flipped 180 degrees from the 25th March.
Although there is now Y2 above the zone,
what was there back on the 25th is now below the zone, which itself
has leapt 200-points to 7150-7250.
But, the real clincher, is B1 has gone
from above the old zone to now being below it, which signifies that the entire
ratio alignment has totally adjusted.
No wonder it has managed to eventually
achieve what it was threatening to in that very first week.
We would fully anticipate 7450 to slip
to R2, leaving 7500 as the next resistance level.
If this is the case then the trading
range should be 7400 to 7500.
Then, it will be all down to the rate of change in the ratios, especially as the clock is ticking and the expiry is now fast appearing on the horizon.
Range:
7400 to
7450 or 7450
to 7600
Activity: Average
Type: Bearish
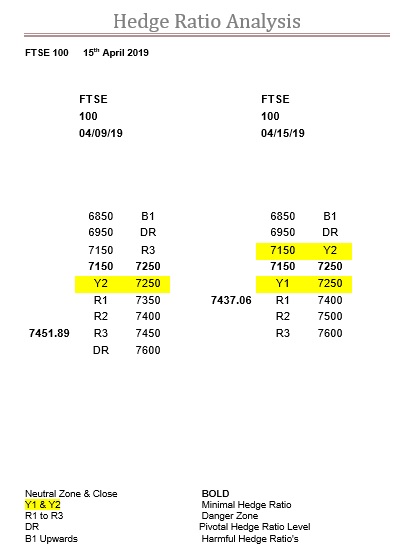
Nb. Our comment on 04/15/19
Well when we made our trading range just
7400 to 7450, we thought the ratios would change sooner rather than later but
it held out all week.
This made last week one of the quietest
this year, with the net move on the week of just minus 14-points.
Despite 7450 getting battered all week
it held, but as you can see R3 has now slipped to 7600, and our trading range
is indeed now 7400 to 7500 just as anticipated.
However, the market is now out of time
as we enter the rollover and expiry, which this week is on the very unusual
Thursday.
This means 7400 is the really critical
level, as below it is now all just Y1.
The good news is, as the ratios have
fallen so far, that the zone is very likely to move up again.
But, even so, the market is still way ahead of where the zone may end up, so it’s going to be an interesting week for sure.