It will be interesting to see if the July expiry will carry the same aggression as June’s did.
On which subject, we did get R2 ratio all the way up to the corresponding R2 ratio, with the intraday high of 2958.06 on Thursday, so that made it a perfectly balanced expiry.
Sadly, the only aspect missing was the finish in its zone.
Looking forward, into July, then a quick comparison between the two tables above will tell you that the ratio below the zone has come in considerably, whereas above it, this has been far more tentative.
This is backed up by, not only the high level of activity, but also by its type.
So, the only real question that remains is how aggressive the bulls will be able to be now it’s a new trip.
Historically, if the triple can only get up to R2, then an intermediate expiry should struggle with even R1.
Rather oddly, and against most other market commentators, we see these markets as behaving perfectly rationally.
In fact, were the index not to travel the length of their Y ratio bandwidth, then we would find this weird, no matter how wide it is.
In fact, in a triple, it is very rare that you even get a 20-point Y ratio bandwidth, let alone the 150-points we saw in June.
However, in intermediates, then such wide bandwidths are far more common.
Furthermore, coming up against the naturally occurring dynamic delta occasioned by hitting R2 and reversing, is, again, perfectly rational.
Pushing through, to DR or even the B ratios, is when the market is irrational, as it would be ignoring all that futures activity in the opposite direction.
To put all this into plain English, then for this expiry, we would fully expect a trading range of 2970 all the way down to 2795.
Hopefully, then back up to finish in the zone by the 17th July.
The great unknown, is whether it will take R1, R2 or perhaps even higher.
But, at the end of the day, you at least know where those levels are currently.
Range: 2905 to 2955 / 2970
Activity: Strong
Type: On balance bearish
Nb. Our comment on 07/03/19
Well, the “great unknown” has been answered as the intraday high here was 2977.93.
Back on the 25th June R1 was standing at 2970, and today it is 2980, so on Monday the 1st it was probably about half way between the two.
Therefore, we see that as a test of R1, not a breach.
Otherwise, it is looking good, as the zone looks set to move up to 2920-2930, obviously the ratio above the zone are moving out (hence the R1 drift), and as you can see in the table above, they coming in below the zone.
All three are bullish signs.
So, the only problem, is are the bulls that committed that they will buy all those futures forced onto the market through the dynamic delta at R1?
And, now R2 is back to 3005, it is less than 1% above R1, so two hurdles very close together.
The cynics might say, yet another record high on the 4th July, and it happens more often than not, so it’s a tough one to judge, as historically, when so many are away from their desks, it can get a little out of kilter.
But, R2 was enough to stop the triple witching June expiry, both as support and as resistance, so we have to say it should prove too much for July.
And, despite the ratios coming in below the zone, the R ratios down there don’t even start until you hit 2820, and that’s a very long way away indeed.
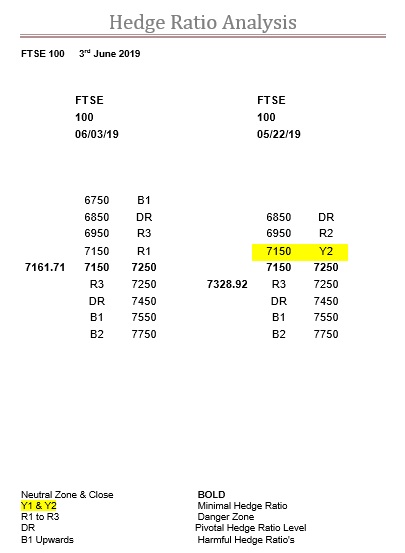
We have to mention the June expiry before we get on to July, and at the start it was all about the bottom of its zone, 7150.
In the middle, it was all about the top of its zone, 7250, and at the end it was the top of the first ratio bandwidth above their zone, or in other words, 7450.
The intraday highs on the last four days being 7469.19, 7454.93, 7460.83 and 7456.79, but always closing below.
Also, the isolated highs do not do justice to how much of a pitched battle it was at that level throughout those respective days.
More importantly, July’s zone has conveniently adapted, as naturally it would, after all, the ratios are a direct reflection of business done.
By comparing the two tables above you can discern in which direction the ratios are moving, which in turn, denotes increasing or decreasing levels of support and resistance.
The most blatantly obvious is the appearance of Y1 below the zone.
Further down from that the support ratios have actually increased, but you can’t miss the fact that these levels are a lot smaller and a lot further away than the resistance levels above the zone.
Obviously, in the meantime, we expect this index to be zone-bound for a while.
However, eventually, it is likely to breakout, and when it does the ratio levels above the zone ratchet up very quickly.
And for those who need clarification, then above the zone you hit R1 after 50-points, at 7500, whereas, below the zone, the corresponding R1 is 200-points below the zone.
So, as it stands, the downside risk is considerable, and the upside is limited.
Especially, with the jump from R1 straight to R3, remembering these ratios are exponential.
Therefore, don’t be fooled by this quiet start, as the potential for big moves is certainly there.
It will be interesting to see if the July expiry will carry the same aggression as June’s did.
On which subject, we did get R2 ratio all the way up to the corresponding R2 ratio, with the intraday high of 2958.06 on Thursday, so that made it a perfectly balanced expiry.
Sadly, the only aspect missing was the finish in its zone.
Looking forward, into July, then a quick comparison between the two tables above will tell you that the ratio below the zone has come in considerably, whereas above it, this has been far more tentative.
This is backed up by, not only the high level of activity, but also by its type.
So, the only real question that remains is how aggressive the bulls will be able to be now it’s a new trip.
Historically, if the triple can only get up to R2, then an intermediate expiry should struggle with even R1.
Rather oddly, and against most other market commentators, we see these markets as behaving perfectly rationally.
In fact, were the index not to travel the length of their Y ratio bandwidth, then we would find this weird, no matter how wide it is.
In fact, in a triple, it is very rare that you even get a 20-point Y ratio bandwidth, let lone the 150-points we saw in June.
However, in intermediates, then such wide bandwidths are far more common.
Furthermore, coming up against the naturally occurring dynamic delta occasioned by hitting R2 and reversing, is, again, perfectly rational.
Pushing through, to DR or even the B ratios, is when the market is irrational, as it would be ignoring all that futures activity in the opposite direction.
To put all this into plain English, then for this expiry, we would fully expect a trading range of 2970 all the way down to 2795.
Hopefully, then back up to finish in the zone by the 17th July.
The great unknown, is whether it will take R1, R2 or perhaps even higher.
But, at the end of the day, you at least know where those levels are currently.
You have just got to love these expiries with so much Y ratio in them, even if they are triples.
From the close at 2744.45 on Monday 3rd, right on R2, this market has just pinged all the way up to Y2 at 2905.
What a ride.
A ride you should have expected and hopefully been on.
The worry is that one shouldn’t forget the bears were out in force, as evidenced by the titanic battle this index had with the R2 support level, and it didn’t take much resistance to encourage them.
In fact, all it took was Y2, the first level of resistance, and not a particularly big one at that, but it nevertheless resulted in a 25-point reverse.
The fact that this market hasn’t encountered a R ratio above the zone means we can’t wholeheartedly say the bears are back on top.
However, being in such a huge Y ratio bandwidth, the only thing we can say for certain is that it will be volatile.
And, with the rollover next week the market will need no more encouragement than that to get a head of steam up, so buckle up as this expiry could just be getting going.
Range: 2855 to 2905 / 2930
Activity: Poor
Type: On balance decently bearish
Nb. Our comment on 06/19/19
Sadly, we missed out on warning you last week that the zone could easily revert back to where it started this expiry at, 2895-2905.
As we have said this really needs to be monitored daily, as judging by the ratio already in situ, this change happened at least a day ago.
So, the end result was a small overshoot, but as today is the rollover it remains to be seen exactly if, or by how much, it will miss.
The very pleasing aspect we did mention last week was that up to then the rally off R2 at 2745 had not encountered a corresponding R ratio.
The nearest was R1 at 2930, also part of our range, which it hit yesterday, with the intraday high of 2930.79.
So far, at least, it is a bit of a lopsided expiry, by that we mean bouncing between R2 and R1, rather than the same levels.
Nevertheless, it is most definitely a R to R expiry, with a good chance of ending in its zone.
So, after a nigh on 200-point journey over the 5-weeks of this expiry it has been down 100-points to R2 then up 200-points to R1, a whopping 10.3%, which in 5-weeks is very decent.
What another titanic battle with R2 for the SPX again.
Excellent.
As we said, “Even more significant, is the fact that R2 has receded to 2745” and “if thebulls do regain control, they have an awful lot of space to express themselves in”, so we sincerely hope you took note.
Between the SPX and the FTSE, we have just witnessed two rather epic ratio inspired support battles, and the good news is, there is still two more weeks of this expiry to go.
The new ratio table is above, and the two aspects to note are that R1 below the zone has slipped to 2770, and R3 to 2695.
The fact that R2 hasn’t moved doesn’t mean it is not weakened, just that it is now at the lower end of R2 rather than the higher end.
Therefore, the ratios are obviously continuing to weaken below the zone, which is bearish, with the saving grace being that the zone itself hasn’t moved.
This, may not be the case for long, unless the bulls really do establish a rally, as the weakness in the ratios below the zone could now easily precipitate a move for it to 2820-2830.
More to the point, the longer the market stays below its zone, the more likely that this could just be the first step.
At the end of the day, fantastic bounce off R2, but it is still in the middle of an enormous Y ratio bandwidth, so nothing resolved yet.
And, if anything, perhaps a sign of things to come, as 2% or 3% daily moves in these conditions are actually only to be expected.
Range: 2770 to 2845
Activity: Poor
Type: On balance just fractionally bearish
Nb. Our comment on 06/12/19
You have just got to love these expiries with so much Y ratio in them, even if they are triples.
From the close at 2744.45 on Monday 3rd, right on R2, this market has just pinged all the way up to Y2 at 2905.
What a ride.
A ride you should have expected and hopefully been on.
The worry is that one shouldn’t forget the bears were out in force, as evidenced by the titanic battle this index had with the R2 support level, and it didn’t take much resistance to encourage them.
In fact, all it took was Y2, the first level of resistance, and not a particularly big one at that, but it nevertheless resulted in a 25-point reverse.
The fact that this market hasn’t encountered a R ratio above the zone means we can’t wholeheartedly say the bears are back on top.
However, being in such a huge Y ratio bandwidth, the only thing we can say for certain is that it will be volatile.
And, with the rollover next week the market will need no more encouragement than that to get a head of steam up, so buckle up as this expiry could just be getting going.
As we said in our last comment on the FTSE back on the 22nd May the defining moment for this expiry we believe will be if the bottom boundary of the zone holds.
On the 29th May the intraday low was 7151.37, before the market managed to close 34-points higher, but was strike one.
Strike two came on Friday 31st May when the intraday low was 7130.85, but the close at 7161.71 was a very hard-fought battle, making it even more impressive to hold in its zone.
This support holding has certainly been helped by the ratio below the zone moving up to R1, but don’t forget this index was born into R3 ratio on the first day of this expiry with the open of 7348.62, and it is also now on strike three.
If Friday was tough then the next time it goes there will be even tougher.
The ratio below the zone may have risen, but it is still the same all the way down to 6950, so if the bottom boundary does crack, then that’s a lot of points before the next level of support.
So, 7150 is really a very critical level, still.
Range: 7150 to 7250
Activity: Poor
Type: On balance definitely bearish
Nb. Our comment on 06/10/19
The start of last week was all about the bottom boundary of the zone, 7150.
And it was a tough hold, with three very serious tests with intraday lows of 7130.85, then 7079.71 and 7138.14 on Friday 31st May, Monday 3rd and Tuesday 4th June.
But on each occasion the market closed back in its zone in a very impressive display of dynamic delta support.
With the bottom boundary holding the target was the top boundary, so on Wednesday the intraday high was 7259.24 marking the inevitable.
And, although it has been above the zone this expiry, the battle the market had with the upper boundary on Thursday was as epic as the one with the lower one, and basically lasted all day.
The fact the market closed at 7259.85, just above the boundary at 7250, meant Friday was always about being back above the zone.
This means 7450 is a distinct possibility as it gears up towards the rollover next week.
With two weeks still to go there is plenty of life left in this expiry.
It is very difficult to appreciate that
this is in fact a triple witch expiry, or quadruple as the US likes to call
them, as the activity remains so low.
The level overall is much more befitting
a biggie, but it all looks passive.
And, we are back to that ridiculously
wide zone.
However, and as we pointed out, the
bottom boundary is hugely significant.
Last Thursday, the 23rd, this
index got as low as 25328 before finishing at 25490.
At the time we mentioned how
statistically irrelevant 10-points is on a twenty-five-thousand-point index,
and the opening gap up the next day just went to underline this.
The fact that the next day, Friday, the
intraday low was 25496, was also very telling.
So, yesterday, it was looking good, but
right towards the end the market got spooked, and, hey presto, strike 3.
The only good news is that the next
level of support is actually rather close, and it jumps straight in at R2,
please see above table.
Otherwise, it’s going to be all down to
the SPX, please see our previous comment on the 21st May, and from
our calculations on the 28th R2 here is still at 2770.
The expiry still has a very long way to
go, but it is heating up nicely, and now we are testing levels, both in this
index, the DJX, but also the SPX, this will ignite activity, if only because of
the dynamic delta, so the fun starts now, for us at least.
Enjoy.
Range: 25000 to
25500
Activity: Very poor
Type: Neutral
Nb. Comment on 06/07/19
Well, we certainly hope you are having
fun by now.
Shortly after our last comment the
bottom boundary did indeed cave in, and as it was already on strike 3 this was
hardly a surprise.
This then left R2 at 25000 as the next
line of support, and if the SPX was having a titanic battle with their R2, the
DJX was certainly not being overshadowed.
Last Friday and on Monday this index
closed at 24815 and 24819 respectively, which was very troubling as both were
deep inside their R2 bandwidth.
The only saving grace was that on both
days the SPX was just then hitting their R2.
It seems it was the SPX that turned the
tide, although with this index being in their R2 then it would most certainly
have aided and abetted.
It is a triple, so big numbers are more
likely than not, but it is worth bearing in mind that the strength of the
bearish sentiment took two indices in R2, which is a lot of dynamic delta
futures buying, to eventually turn the tide.
The fact that this index bounced
straight back up into their zone is only what we would expect, and the same
goes for the SPX.
The unexpected part is how much Y ratio
there still is in both, especially as this expiry is a triple, where we would
expect to see none, or at least, very little.
The only ratios to change here are Y2
drops to Y1 and DR comes in to 24000, both below the zone.
As it stands this index is now back in its super-wide zone, so happy days, but the real battle will be the SPX we believe, and there, might it even get back to bullish territory?
Actually, the first thing we should
point out that back on the 24th R2 was at 2770, as seen in the table
above, but it was unchanged when we calculated the ratios in the SPX on the 28th,
and referenced in our comment on the DJX on the 29th.
This is very important, as yesterday’s
intraday low was 2766.06, but also it was the manner of this low that was
significant, as this was just a spike, whereas the market did hover around the
2770 level for quite a while.
Whilst, on this subject, it was a very
similar story for the DJX and their level at 25000.
Even more significant, is the fact that
R2 has receded to 2745, and interestingly this is the only ratio to move.
2770 will naturally turn into what we
refer to as a “step-up”, but hopefully, unless you are a bear of course, the
market will not need to test this level again, the job being done yesterday.
However, this is far from being a done
deal, and below the zone the market is in bear mode, and falling ratios are
bearish, but it is the first decent level of support this index has
encountered, so it might rejuvenate the bulls.
Having said that, it is worth noting
that yesterday this index gapped down at the open, starting at 2790.25, so
already significantly below R1 at 2795.
Of course, this now makes 2795 a hurdle,
so now a critical level.
Basically, now the front line between the
bulls and the bears.
Also, please be aware, above the zone, which is still 2845-2855, there is still acres of Y ratio, so if the bulls do regain control, they have an awful lot of space to express themselves in.
Range: 2745 to 2795
Activity: Poor
Type: On balance only just bearish
Nb. Our comment on 06/05/19
What another titanic battle with R2 for
the SPX again.
Excellent.
As we said, “Even more significant,
is the fact that R2 has receded to 2745” and “if thebulls do regain
control, they have an awful lot of space to express themselves in”, so we
sincerely hope you took note.
Between the SPX and the FTSE, we have
just witnessed two rather epic ratio inspired support battles, and the good
news is, there is still two more weeks of this expiry to go.
The new ratio table is above, and the
two aspects to note are that R1 below the zone has slipped to 2770, and R3 to
2695.
The fact that R2 hasn’t moved doesn’t
mean it is not weakened, just that it is now at the lower end of R2 rather than
the higher end.
Therefore, the ratios are obviously
continuing to weaken below the zone, which is bearish, with the saving grace
being that the zone itself hasn’t moved.
This, may not be the case for long,
unless the bulls really do establish a rally, as the weakness in the ratios
below the zone could now easily precipitate a move for it to 2820-2830.
More to the point, the longer the market
stays below its zone, the more likely that this could just be the first step.
At the end of the day, fantastic bounce
off R2, but it is still in the middle of an enormous Y ratio bandwidth, so
nothing resolved yet.
And, if anything, perhaps a sign of things to come, as 2% or 3% daily moves in these conditions are actually only to be expected.
The
FTSE is a classic example of the expiry of one month (May) leaving another
(June) in a difficult position.
For
May, where the zone was 7350-7450 at the end, it was a tremendous achievement
for this index to claw itself all the way back up from R1 at 7150 (intraday and
expiry low 7150.89 13th May) to get to consecutive closes of 7353.51
and 7348.62 on the final two days. Well done.
The
trouble, as is plain to see, that in June the zone was, and still is,
7150-7250.
And
just to compound that, the ratio above it is already R3.
So,
June has been born into a very high level of ratio.
No
wonder it doesn’t know which way to turn.
Will
it be necessary for this index to test DR at 7450, who knows?
As it
stands, to us it doesn’t appear as if it has the bottle, as 7350 seems to be a
tough hurdle, and this is only R3, which is what it’s in anyway.
It is
not beyond the realms of possibility, but, as is also very plain to see, the
ratios above the zone are far far greater than those below it.
Therefore,
if it does, and 7550 is not impossible, as triples often go between the B
ratios, or at least did a while back, we see this as only deferring the
inevitable.
The
real issue for us, in the five weeks that lie ahead in this expiry, is whether
the bottom boundary of the zone will hold.
As,
looking at it as it stands, the next ratio support level doesn’t kick in until
6950.
And,
as this index is already ploughing through R3, then we doubt R2 will provide
that much support.
The next few days should clear things up a great deal, but if we are to get a DR to DR expiry, and don’t forget May traded between the R ratios, you could be looking at a range of 600-points, which definitely deserves a wow wee.
Range: 7250 to
7450
Activity: Poor
Type: On balance definitely bearish
Nb.
Our comment on 06/03/19
As we
said in our last comment on the FTSE back on the 22nd May the
defining moment for this expiry we believe will be if the bottom boundary of
the zone holds.
On the
29th May the intraday low was 7151.37, before the market managed to
close 34-points higher, but was strike one.
Strike
two came on Friday 31st May when the intraday low was 7130.85, but
the close at 7161.71 was a very hard-fought battle, making it even more
impressive to hold in its zone.
This
support holding has certainly been helped by the ratio below the zone moving up
to R1, but don’t forget this index was born into R3 ratio on the first day of
this expiry with the open of 7348.62, and it is also now on strike three.
If
Friday was tough then the next time it goes there will be even tougher.
The
ratio below the zone may have risen, but it is still the same all the way down
to 6950, so if the bottom boundary does crack, then that’s a lot of points
before the next level of support.
Nb.
Our comment from 05/24/19 (Not published online)
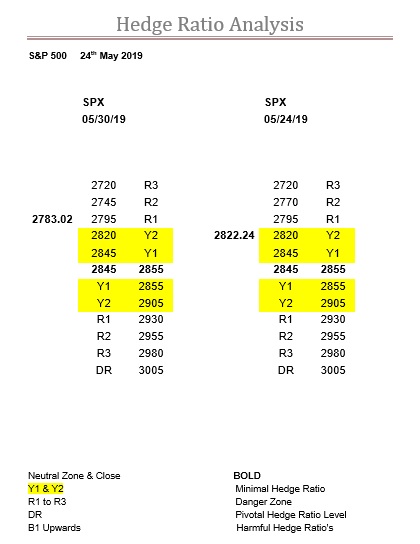
Just
as we said “please take it for granted
that the zone here should be 2845-2855” and now we see confirmation of that
in the table above.
Although,
in truth, had you been following the SPX then on Monday, Tuesday and Wednesday
it would have been blatantly obvious the impact that 2845 and 2855 was having
on this index.
Nevertheless,
it is good it has got the move done, as delaying it can retard the development
of the ratios until it does so.
However,
for us, the real question is whether or not the intraday low yesterday was a
test of R1 or not?
This
low was 2805.49, and as one can see in the tables above, R1 has stayed put at
2795.
10-points
even when this index was down 50.78-points is a lot to ask of the corresponding
spike in the Vega, so we are going to call that close, but a miss all the same.
The
other potentially relevant fact is where the market closed, at 2822.24.
As
this is just above Y2, which also hasn’t changed.
This
close is bullish, but don’t forget, we are just talking about Y2.
The
more important level is the bottom boundary in the DJX, which is at 25500, and
importantly that index closed at 25490.
10-points
on a twenty-five-thousand-point index is statistically irrelevant, but below is
below.
This
makes today’s open very crucial, for both indices.
So, there is light at the end of the tunnel, but without that solid test of R1 there is a risk remaining, but now there is as much Y ratio above the new zone as there is below it, so the potential is definitely exciting.
Range: 2795 to 2845
Activity: Moderate
Type: On balance bearish
Nb.
Our comment on 05/30/19
Actually,
the first thing we should point out that back on the 24th R2 was at
2770, as seen in the table above, but it was unchanged when we calculated the
ratios in the SPX on the 28th, and referenced in our comment on the
DJX on the 29th.
This
is very important, as yesterday’s intraday low was 2766.06, but also it was the
manner of this low that was significant, as this was just a spike, whereas the
market did hover around the 2770 level for quite a while.
Whilst,
on this subject, it was a very similar story for the DJX and their level at 25000.
Even
more significant, is the fact that R2 has receded to 2745, and interestingly
this is the only ratio to move.
2770
will naturally turn into what we refer to as a “step-up”, but hopefully, unless
you are a bear of course, the market will not need to test this level again, the
job being done yesterday.
However,
this is far from being a done deal, and below the zone the market is in bear
mode, and falling ratios are bearish, but it is the first decent level of
support this index has encountered, so it might rejuvenate the bulls.
Having
said that, it is worth noting that yesterday this index gapped down at the
open, starting at 2790.25, so already significantly below R1 at 2795.
Of
course, this now makes 2795 a hurdle, so now a critical level.
Basically,
now the front line between the bulls and the bears.
Also, please be aware, above the zone, which is still 2845-2855, there is still acres of Y ratio, so if the bulls do regain control, they have an awful lot of space to express themselves in.