We just hope
you were listening, as way back on 21st January, at the very start
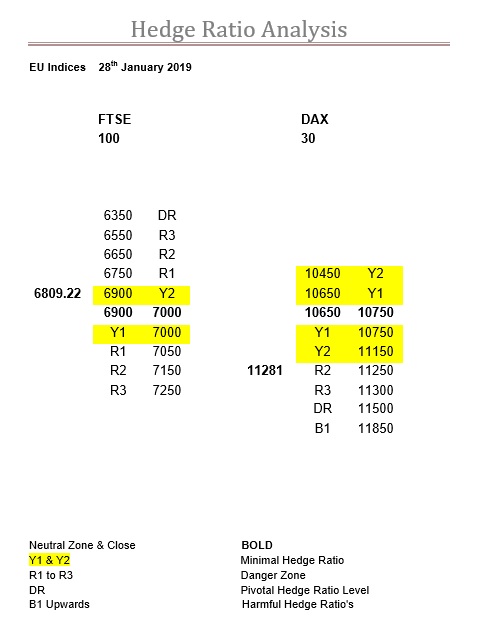
of this expiry, in the FTSE we said; “So, that means, at the moment, there is
precious little ratio from 6750 all the way up to 7050”.
6750 was
also R1, and the intraday low on 28th Jan was 6734.00.
Today, the
corresponding R1 is lurking at 7050, just waiting to ambush this index.
Worth noting
is that this is backed up with R2 at 7100.
The even
better news is that we are only just at the half way point in this expiry.
Apart from just being aware of the ratios in the FTSE it is also worth taking note of where the DAX and the US indices are in relation to their ratios.
Range: 6750
to 7050
Activity: Average
Type: On balance bullish
For the DAX
we couldn’t have been more explicit, and again from the very start of this
expiry, back on the 21st Jan, when we pointed out the zone could be
anywhere in the Y1 ratio bandwidth, and the presence of R2 and R3 at 11250 and
11300 respectively.
So, no
surprise the zone has moved to where it is.
Also, no
surprise the intraday high and, so far at least, the expiry high, back on the
25th Jan, was 11321.
In fact,
since that high the DAX has fallen 141-points.
To put this
in perspective the FTSE since the 25th has risen 211-points, a very impressive
350-point divergence.
Two main
points to be aware of here, the first is that R3 has slipped to 11450, while
the second is that there is still a huge amount of Y ratio still present.
The activity has also diluted somewhat the “every man and his dog” bullishness, and if this does crack, then this index is still on the edge of a Y ratio precipice.
Just to
remind everyone what we said last week about the FTSE; “firstly, the zone, and although it has dropped to 6750-6850 it could in
fact be anywhere between where it is now and where it was last week…. So, that means, at the moment, there is
precious little ratio from 6750 all the way up to 7050”.
Therefore,
the fact the zone today has moved to 6900-7000 should not come as too much of a
surprise.
Nevertheless,
it is worth remembering that it was 6750-6850, as the close last Wednesday was
6842.88, and the last two intraday highs have been 6854.59 and 6858.19 on
Thursday and Friday respectively.
Obviously,
the zone will have an impact, so it should definitely be taken note of, but the
situation remains much as it was, with little or no ratio from 6750 up to 7050.
The fact that the zone kept the FTSE in check last week runs slightly contrary to the high level of activity, so we can only see things getting more and more animated as this expiry progresses, and especially so now the zone has moved.
Range: 6750
to 6900
Activity: Very good
Type: Neutral
Carrying on
with the “what we said last time” theme, here is it for the DAX; “today, will be the decider we feel, as the
proof will be how this market reacts to the R ratios at 11250, and especially
at 11300, so, best also pay close attention to any opening gaps”.
When we
wrote this the DAX had just jumped 286.92-points to finish at 11205.
The market
actually gapped down at the open on the Monday and it wasn’t until Friday that
it managed to get back to where it was.
In the
meantime, neither R2 or R3 haven’t moved, so it is going to be a definitive
Monday with this index camped on the R3 doorway.
Actually, it
was very interesting to see how it coped with R2 at 11250, as after all that Y
ratio it must have been bit of a surprise to walk into that futures selling
generated by the dynamic delta.
It is very
aggressive, and, again, as we said, “every man and his dog” here are bullish,
but make no mistake, they will now have to seriously work hard to achieve their
ambitions.
And, please bear in mind, if it does go sour, there is nothing but minimal Y ratio below, so it could be “calamitous” with virtually no ratio support at all underneath.
Even though
the US markets were closed on Monday we still expected a bit more zip out of
them during the rest of this week.
Especially
considering what we said about the SPX in our last comment; “although, the Y ratio bandwidth is
considerably thinner, it is still absolutely massive”.
However, the
ratios have been evolving, and we are seeing some good strengthening below the
zone and some weakness above it, which is bullish.
To highlight
this, we have lost Y1 below the zone altogether, whereas above it Y2 now starts
at 2655, and more importantly R1 slips from 2670 to 2680.
This is
significant, as on last Friday the intraday high was 2675.47, and it has
noticeably not gone near there since.
The way it
is going also means we may well see a move up in the zone to 2645-2655,
competing the bullish triumvirate.
At the end of the day, we think it is the DJX that is going to be the deciding factor, so read what we say below first, then apply it to what may happen here in the SPX.
Range: 2605
to 2680
Activity Moderate
Type: On balance bearish
As we said in the NDX; “so,
don’t take those ice-skates off any time soon”.
Activity remains low, but basically the benchmark is so small,
by just achieving what they have done, it is actually rather pathetic.
Nevertheless, it hasn’t stopped them adding about 50 new
strikes.
No problem if it stimulates interest, but it plainly doesn’t, so
why bother?
Y2 below the zone has come in a fair way, but at the end of the day it is still all Y ratio, so enjoy the skating.
Range: 6425
to 6825
Activity: Average
Type: On balance only just fractionally bearish
We certainly
“bigged up” the DJX in our SPX comment above, and for very good reason.
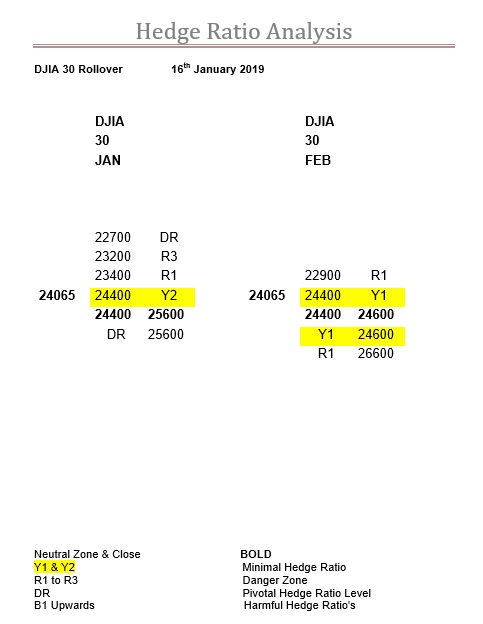
In our last
comment about the DJX we mentioned; “therefore,
for this expiry, 24600 is a really key level”.
And the
market must have been listening, as that very day, Tuesday 22nd, the
DJX opened at 24607, which also became the intraday high.
The next day
it had a very aggressive test of its zone, peaking at 24700 and falling as low
as 24307, both rather coincidentally being 100-points either side of their
zones upper and lower boundaries.
However,
yesterday was a bit more precise, with the intraday high of 24626, and intraday
low of 24422, making this a near perfect zone bandwidth test.
To be fair,
we would count both as zone bandwidth tests, so today fully expect a breakout.
The bandwidth
test alone suggests it, two in a row, double hint, and on top of all this,
another test would be strike 3 anyway.
The SPX
certainly paints a better picture than when we looked at it back on the 15th
Jan for the rollover.
Although,
the Y ratio bandwidth is considerably thinner, it is still absolutely massive.
Currently,
it stretches from 2495 all the way up to 2670, which is, naturally, where this
index came to rest last Friday, being closed Monday.
So, it is
still 175-points (6.6%), and this seems to be the way of it these days, as just
having a 1% to 2% Y ratio bandwidth is but a distant memory.
Therefore,
it will be a real test of this index today, whether it wants to take on the R
ratios from the off, or take advantage of this huge bandwidth.
Nice to see a start to a new expiry begin with it all to play for, and worth noting is the very decent level of activity, which means a respectable degree of engagement.
Range: 2605
to 2670 or 2670
to 2715
Activity Strong
Type: On balance bearish
Sadly, we never did the rollover for the NDX.
This means our last coverage was way back on the 8th
Jan and considering Y2 then didn’t kick in until 7125 we are not really
surprised by what happened.
Although we have no idea how the tail end of the last expiry
developed, if indeed it did at all, but we do recognise that what we are seeing
here is exactly the same as what we saw this time last expiry.
So, don’t take those ice-skates off any time soon.
Perhaps worth noting that the intraday high on Friday was 6816.23, so they may well already have an inkling of where Y2 in Feb is.
Range: 6425
to 6825
Activity: Average
Type: Neutral
In the Jan
expiry just gone the SPX got its way on the rollover Wednesday, which left the
DJX here, free rein for the actual expiry.
Suffice it
to say the zone in both Jan and Feb have not changed, and the settlement price
on Friday was 24574, so we would say spot on really.
Who would
have thought, that after all that trouble getting over 24100 and back into
their Y ratios, that they would eventually succeed come the expiry, so bravo
the DJX.
Despite the
level of activity, sadly here the benchmark is so low anything looks good,
there has been little change in the ratios since we last looked.
In fact, the
ratios are so thin, the zone could actually stretch from 23900 all the way up
to 24600.
Therefore,
for this expiry, 24600 is a really key level.
Unless the ratios start getting populated this is going to be a real rollercoaster ride this expiry, so either hang on tight or sit back, enjoy, and wave those hands in the air.
When we last
looked at the FTSE the zone in January was 6800-6900 and in Feb it was
6950-7050.
On rollover
Wednesday, the FTSE closed at 6862.68, close enough to the middle of the zone,
and the close of Friday, as one can see, would have been where the zone was, so
job done really.
Now, we come
to where the ratios and the zone are now.
Firstly, the
zone, and although it has dropped to 6750-6850 it could in fact be anywhere
between where it is now and where it was last week.
So, that
means, at the moment, there is precious little ratio from 6750 all the way up
to 7050.
When you add
the Y ratio at either end then we have the potential to have a great expiry
with trading range of 350-points, or just over 5%.
Enjoy.
Range: 6850
to 7050
Activity: Outstanding
Type: On balance only just bearish
Boy, do we
now regret not doing the rollover for the DAX.
Our last
comment on this index was back on the 7th Jan, when the market had
just closed at 10767.
This is
worth recalling as the zone then, for the Jan expiry, was still at 10950-11050,
so last Wednesday, the rollover, when the market closed at 10931, we thought
job done.
However, and
here’s the regret, we had no idea how bizarre Feb was shaping up to be.
As one can
see from the table above, the ratios are seriously lopsided, and more
interestingly the zone is down at 10650-10750.
However,
where the zone is concerned, it could very easily flip to anywhere in the Y1
ratio bandwidth.
And that’s
the issue here, as Y ratio is all there is under the zone.
It may not
go sour, and the delta ratio of 500% suggests every man and his dog thinks it
won’t, but if it does, it could be calamitous. Unless you’re a bear of course.
Today, will be the decider we feel, as the proof will be how this market reacts to the R ratios at 11250, and especially at 11300, so, best also pay close attention to any opening gaps.
DJX Jan to Feb Ratio Rollover Table 16th January 2019
For the DJX this expiry it was all about
23400, which we have covered at great length in previous articles, but once
over that hurdle and into its Y ratio bandwidth we mentioned two other hurdles
in its way.
“We call them “step-ups” and here there are two in this mammoth
Y ratio bandwidth, at 23800 and 24100”.
As yesterday’s intraday high was 24099
it is this second one that has caught our attention.
Today is the day of course, and the SPX
being anywhere in the vicinity of 2600 is job done to us, which leaves the DJX
quite a bit shy of theirs.
Now, the problem with getting over 23400
certainly held this index back, thereby increasing the disparity.
Furthermore, it is in Y ratio, so not
that painful, but 24100 is quite a hurdle, and once the SPX has had its way our
fear is that this index may look towards somewhere circa 23600 as the next
cheapest alternative to expire around come Friday.
As we have all expiry, we still feel the DJX is the kingmaker, so it will be the one to watch right to the end for sure.
Range: 23400
to (24100) / 24400
Activity: Moderate
Type: Bearish
To be fair this is now becoming bit of a
theme, the Feb DJX being like the FTSE and SPX with little or no ratio in situ
at this moment in time.
Intermediary to intermediary or not this
is unusual.
Pointless to speculate why, it may be
for different reasons in each market, or everyone could simply be heading for
the hills, and we don’t mean to go skiing, we just see the end result.
The fact that the Y1 ratio bandwidth
here stretches for 3700-points is bad enough, but this is not the entire story.
Basically, the zone (zero ratio) could
be from 23400 all the way up to 24600.
So huge potential for extreme volatility
and whipsaw.
This, for you, may be a good thing of
course.
If the market blasts north no doubt the
politicians will take full advantage, but make no mistake, this index is very
vulnerable with no ratio to support it.
If it skids down to 23400, we rather doubt
the seriously minimal Y1 will have much, if any, impact, and if it then carries
on to 22900, will R1 be enough?
It was a truly awful end to 2018 and at
this very point in the Dec expiry we were using the analogy of it escaping from
under the pile-driver it was trapped beneath.
The net result was the Jan expiry opened
with an unprecedented bandwidth of Y ratio, a truly astonishing 350-points
wide.
It still didn’t stop the SPX from
testing R3 at 2345 with the intraday low of 2346.58, which, so far, is the
expiry low as well.
The fact the market responded, and quite
emphatically, finishing up 117-points that day at 2467.70, revealed it had
broken free from the pile-driver, courtesy of the new expiry no doubt.
Rather intriguingly the Y ratio
bandwidth has stayed incredibly broad, so it has the opportunity to cut loose,
but the DJX was quite a limiting factor.
The fact that their zone is hovering
near the market, or vice versa, we suspect means they want a quiet expiry.
Good luck, is all we can say, as the Y ratio bandwidth still stretches from 2470 all the way up to 2685, so from our perspective anything can happen under these circumstances.
Range: 2570
to 2580 or 2580
to 2605
Activity: Poor
Type: On balance only just bullish
Don’t forget we do not make the rules,
just report the numbers.
This is, in fact, the essence of the
problem, as there are no numbers.
It may well be that one of the other two
step up and take charge, but as things stand here in the SPX it certainly won’t
be this index doing that.
Intermediary expiries to intermediary,
apart from being the least common, tend to be noticeably underrepresented, but
this is going way past that.
The fact is that the zone is a little
bit higher, but the minimal Y1 ratio is so minimal that it could be the zone in
its entirety.
The Y ratio bandwidth “is only”
290-points wide, so less than Jan at this stage, but this is still ridiculously
wide, and, more to the point, there is no depth.
On both sides the ratio only goes as
high as R2, at least last expiry we saw some DR.
Still a few days to go, but skittish doesn’t go anywhere near enough to describing how this index may be in the Feb expiry, and that’s in either direction.
Well it certainly has been a nomadic
zone for the Jan expiry in the FTSE.
In fact, it has changed every time we
have commented, which is actually a reflection on how very low the already minimal
Y level of ratio really is.
This then has led to the fact the zone
could be anywhere from 6650 to 6900.
Of course, this expiry we have already
plumbed the depths of 6536.53 where it took a colossal effort by R3, then at
6550, to turn the tide.
We did mention, that on the flip side,
resistance may be more sensitive, and we have already seen this market test R1
at 6950.
Now, this index is tantalisingly close to its zone, and with just two days to go to the rollover it will be a very nervy time.
Range: 6900
to 6950
Activity: Poor
Type: Neutral
We look at the calendar every day but
still the fact it’s the rollover already comes as a surprise.
Doubly so as it has been a very hectic
start to the year already.
Therefore, we suspect, a bit like us,
many participants have been blindsided as this must be the poorest
representation of ratio we have ever seen in the FTSE.
Of course, with March just around the
corner, then it will not be helped with many sitting on their hands as well.
When you couple this with the fact this
is the first, of only four, intermediary to intermediary expiries, then this
just compounds the lack of ratio.
So, what we say above, about a nomadic
zone, then this expiry is not going to be any different.
In fact, if, and that is a very big if,
this index suddenly develops a degree of sensitivity, then it might just trade
within the Y ratio bandwidth.
However, when one realises that this
bandwidth is 650-points wide then one will also realise that R1 will be very
hard pushed to reverse a market that has that much momentum behind it.
And so far, that is pretty much as high
as it goes, scarily.
Seems like the Jan expiry was just the warm-up act for this the Feb expiry.
It’s not a
big change in the SPX, more of interest than significant as well.
The zone has
moved up to 2545-2555, and normally we would comment on this being like taking
a super tanker through a three-point turn in a country lane, but the phenomenon
of 290-points of minimal Y ratio makes this not the case, and in fact rather
mundane.
It is
perhaps worth noting, that this move up does put the market inside its zone, so
in neutral, rather than above it, and therefore in bullish territory.
However,
with so little ratio about you can pretty much guarantee two things; firstly,
volatility, and secondly, a nomadic zone.
Please don’t forget this index has already tested R3 at 2345 this expiry, so is 8% up from its low, and with virtually two weeks to go, so the bears may not be squealing yet, but time is now not on their side, and the R ratios above the zone still don’t even appear until 2725, so the final battle for this expiry is still to come we suspect.
Range: 2545
to 2555
Activity Very poor
Type: On balance just bearish
For the NDX no change in its zone, but rather intriguingly no
further additions of any strikes.
Although activity has improved, it really isn’t worth writing
home about.
Especially, when one considers that it is very stunted overall,
so a little goes a very long way and yet this was the best it could do.
It did have fun around its zone, closing in it and bouncing off it, but at the end of the day the minimal Y ratio is actually very minimal, and what’s more, there are no step-ups, so it really is just one exceedingly vast ice-rink.
Range: 6275
to 7125
Activity: Moderate
Type: On balance only just bearish
It is difficult
to emphasise strongly enough how significant a level 23400 is, and has been,
and not just for the DJX, but also for the other two US indices, and by default
the European exchanges as well.
The first
encounter was on the 28th Dec with the intraday high of 23381, and
when it was R2, which turned a 250-point gain into a 76-point loss.
It shied
away from it on New Year’s Eve.
But attacked
again on 2nd Jan with the intraday high of 23413.
The next day
saw that 660-point fall.
By the 4th
it was now R1 and the bulls were emboldened again, courtesy of the SPX and NDX,
and it made a good intrusion but finished right on it, despite this being
strike 3 and a lot weaker.
And,
yesterday, it didn’t have it all its own way, but finished on the right side,
if you are a bull, so hopefully job done, but the heavy weather it made of it
does not inspire confidence for sure.
As we say
above in the SPX, we suspect there the deciding battle is still to come, so we
are certain that here there will be one here as well.
We call them “step-ups” and here there are two in this mammoth Y ratio bandwidth, at 23800 and 24100.
Hope you
were listening in the FTSE as “obviously,
there is still considerable risk, but now we are into a new expiry, and if it
can get back above 6750, then it could become a very rapid ascent up through the
zero-ratio zone to 6900”.
The intraday
high on the Wednesday and Thursday was 6753.29 and 6753.14 respectively, so
Friday would have been strike 3.
However, the
fact that the zone has changed, and the intraday high and low on Friday was
6850.37 and 6692.50, we suspect that this change happened on Friday.
Again, these
ratios should be calculated daily, as that is almost the perfect zone bandwidth
test, 6700 to 6850.
We say,
almost, but really seven and a half points on a six-thousand-point index, that
traded 150-points in one day, is probably the closest you will get to perfect.
Basically, a
drawdown of 0.11%.
This should
result in a breakout today, the only caveat is the DJX, which if you read our
note on Friday you will appreciate how significant 23400 really is, and the
close was above it, but only just, and that is a very large index, so 33-points
is only 0.14%, which is rather ironic considering the above.
For the
FTSE, obviously 6850 is a poignant level, but if it gets above that then there
is still plenty of Y ratio above for it to play around in.
Although, due to the nervousness still embedded in this market, we rather doubt it will be the corresponding R3 ratio (intraday expiry low 6536.53 with R3 at 6550) so be rather wary circa 6950.
Range: 6700
to 6850
Activity: Poor
Type: Bullish
There were
two things we said in our last comment on the DAX that are worth repeating, “this makes 10600 very significant” and “it was the level of activity that caught our
eye”.
The very next
trading day the intraday high was 10612.
Also, as you
can see below, that despite all the closures here over the festive period they
have still maintained a very impressive level of activity.
Of course,
not calculating the ratios daily coupled with a lot of closures makes any form
of continuity here rather difficult, but despite this it has been fascinating
to see their zone hold fast.
When this
index was heading towards 10000 this looked misplaced, but after yesterday it
doesn’t look so awkward anymore.
Using a
broad brushstroke, the two pertinent levels over the last two weeks have been
10450 and 10250, and although the ratios may have fluctuated a little bit they
have stood out, and actually over the last two weeks been counted as well.
The Y ratio bandwidth may have shrunk a bit, but it is still a very impressive 650-points, so don’t expect any quiet days anytime soon.