Nb. Our comment from the 06/30/20
Actually, you just couldn’t make this up even if you wanted to, as the very day we published, after two very nondescript days, we got a 100-point move.
Furthermore, in the meantime, it has still been all about the ultra-wide zone.
We did notice yesterday however, that, for the first time, the zone begun to resemble the normal width it is today.
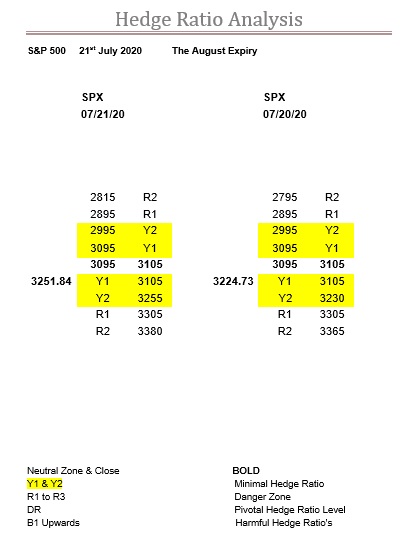
Although, the last couple of days of last week, 3000 came into the picture, so the zone could easily have stretched from 2995 all the way up to 3105, and that, most definitely, would have been the widest zone in the SPX ever.
We don’t want to come across as labouring the point, but as this expiry moves forward, it would be well worth remember how very little ratio there was, and, more significantly, where it wasn’t.
But, at least now, a third of the way through, it seems to have made up its mind.
Therefore, there is absolutely no coincidence, that the close yesterday was where it was, right in its zone.
Also, just to underline this, the ratios either side of the zone, have begun to act as if this is where it now wants to be.
The fact that the ratios have now decided, should not lull you into any false sense of security, as this market still has a ginormous Y ratio bandwidth.
And, today, it may well decide upon which side of the zone it wants to be in.
Which is no trivial matter, as below the bears are in control, whereas above, you’ve guessed it, the bulls are in charge.
Whichever wins, it still has a Y ratio bandwidth of 335-points, so really, the fun is just getting going.
Range: 2895 to 3230
Activity: Good
Type: Neutral
Nb. Our comment for 07/07/20
Just like London across the pond, here in the SPX it has been all about Y2 as well.
We used to publish daily, and before the market opened, so everyone who took note would know well in advance where the potential speedbumps were.
Back on the 30th June we published Y2 as being at 3155, above the zone, and by Thursday 2nd July, this had not changed.
The intraday high that day was 3165.81, which in truth doesn’t do the battle at 3155 justice, and resulted in the eventual close at 3130.01.
On Monday 6th Y2 slipped to 3180, so we were hardly surprised to see the intraday high of 3182.59, but the recovery towards the close at 3179.72, showed exactly what their intentions are today.
Normally, this would mean, a gap up at the open, to try to leapfrog this particular hurdle.
Ironically, this would not have been necessary, as today, Y2 has slipped further, to 3195.
So, with the market opening easier, this was a lot of unnecessary effort, as it leaves them with it still all to do.
And it is not just Y2 that has slipped above the zone, with both R1 and R2 moving out, giving this market plenty of leeway above it.
Furthermore, the potential for the zone to move up, to 3095-3105, is back on again.
At the end of the day, Y2 should not be that great an impediment, and in truth, the Y ratios are so low they are really only calculated to reveal early signs of directionality, they are so minimal, so bear this sensitivity in mind, as this index still resides towards the top of a 360-point Y ratio bandwidth.
Other than that, it is all looking good, but very thin.
Range: 2895 to 3255
Activity: Poor
Type: On balance bearish