Nb. Our comment from the 11/02/20
Well last week had it all in the FTSE, and perhaps we should have calculated the ratios during it, as the changes in the above ratio table are significant, and now we will never know when they occurred.
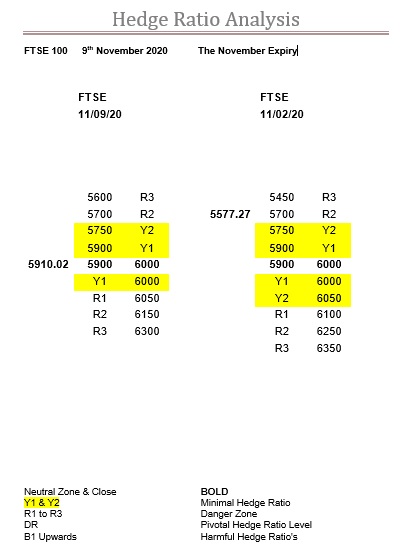
We left this index with a decent cushion above R1 at 5750, with R2 at 5700 backing it up.
Monday was OK, even hinting at getting back to its zone, but Tuesday was another matter entirely.
It had a solid test of R1 with the intraday low (at that time) of 5755.96, rallied back above 5800, but then, and don’t forget Wall St. had lost 650.19 that Mon, so in this context the rally was impressive, it then went back for strike 3 at R1.
This time 5750 didn’t hold out, no real surprise, but at least it held above R2.
Then, exactly the same as the week before, this madness that the open is the previous day’s close, meant that officially the market opened at 5728.99, but in reality, it was more like 5662.
Below R2.
So, the next ratio level was R3 at 5600, which the market hit very early on, then rallied back up to 5655, followed by a steady decline back down to 5600, when the Street again cast its black shadow, Wednesday being the day it lost 943.24.
Actually, it proved quite remarkable that the FTSE has even managed to stay in touch with 5600, considering, which held true for the remainder of the week too.
Furthermore, if the market was clear and transparent, and allowed to fall or rise towards the ratio levels, rather than leapfrogging them courtesy of the opening or closing auction, then would these falls have been so severe?
Probably not we believe, as R2 would have provided a decent support level had it been allowed to, and therefore might have helped alleviate the 100-points between it and R3, rather than see it freefall in one day, down to this, the next support level.
Although, this perhaps may be by design, who knows?
Nevertheless, the ratio levels have now changed, and the FTSE is now stuck in its R2 ratio bandwidth.
The top of this is now 5700, while the bottom is 5450.
5600 should now only be influential by way of remembrance of what it once was.
But, moving around in R2 ratio, should not be a comfortable experience, so, despite there being three weeks left, getting out of here should be the markets immediate goal.
In another significant change, above R2 it is now all Y ratio, which makes 5700 a very significant level.
And the way it’s going, this could easily drop to 5650.
The final significant change, is the zone, which has moved down, never good, to 5900-6000.
However, this could have happened anytime last week, so probably already discounted, and anyway, it does actually mean it is a slightly easier target to achieve for the expiry.
The problem is, that this market is now stuck in a bandwidth that is 250-points wide, with the only saving grace being, that the ratio above it are lower than those below it despite them all being R2.
The good news is, that if it can get above 5700 (potentially 5650) then it is plain sailing all the way back up to 6000.
Either way, it’s going to continue to be fascinating.
As a final dig, in Friday’s closing auction, the market hit a high of 5600, so, why, if this is the “official” close, does not the high (or low) in this period be counted as the “official” level for that day’s data? Shouldn’t be allowed to have it all ways we humbly suggest.
Range: 5450 to 5700
Activity: Moderate
Type: Neutral
Nb. Our comment on 11/09/20
Like a scalded cat no less.
As we said, meandering around in R2 would not be a comfortable experience, and its immediate goal should be to get out of it.
It didn’t quite make it last Monday, but the FTSE did however close just above the other level we mentioned, 5650.
Tuesday saw it explode back above 5700, and right back into the Y ratios.
Once back into the Y ratio we did also say their zone should be “plain sailing”, so we were glad to see it close just above the bottom boundary on Thursday.
The one surprise we had was, especially after all the hard work getting there, was how easily this bottom boundary conceded on Friday.
And then, the absolute meal the market made of getting back above it, only succeeding after many attempts, and then not until the early afternoon.
Obviously, we would now expect it to push on and have a go at its upper boundary.
However, the caveat here, is keep a wary eye on the US, as the SPX is now battling Y2, with the R ratios now not far ahead, so it may not get a helping hand as much as it has from across the pond.
But there is still two weeks to go, so although we would be more than happy to see this index remain zone-bound for the remainder of this expiry, we don’t think this will be rather likely.
So, just watch for the relevant ratio levels, while noting where the SPX is in relation to theirs, and act accordingly.
Also, please remember, that it is the mighty Dec expiry up next, and it is already a beast.
Range: 5900 to 6000
Activity: Moderate
Type: On balance bearish